The term “cash is king” has its roots in how to run a business and was popularised following a stock market crash in 1987. While the phrase originally highlighted the importance of cash over credit in business operations, recent trends reflected in Reserve Bank of Australia (RBA) data suggest that cash is no longer 'king' for transactions.
Cash use in Australia fell from around 70% of all payments in 2007 to around 15% in 2022. Similarly, the proportion of high cash users – defined as those that make 80% or more of their in-person payments with cash – declined from more than 40% in 2007 to 7-9% in 2022. While the trend is clear, when you dig deeper there is still a clear role for cash in the Australian economy.
Cash use 2007-2022


Source: RBA, Submission to the Inquiry into Bank Closures in Regional Australia, 2023.
Below, we look at some analysis on the role of cash in Australia’s future and explore the implications on a public policy response.
Who is still using cash in Australia?
The RBA recently found that while a steady decline in cash use has been broadly observed across society, some demographic groups were more likely to have a higher proportion of high-cash users. The RBA found that:
- 18% of respondents aged 65 and above were high cash users compared to 3% of those under the age of 50;
- 17% of people in the first household income quartile (lowest income) were high cash users, compared with only 2% in the fourth household income quartile (highest income); and
- 9% of people in regional/remote areas were high cash users compared to 7% in major cities.
Proportion of high cash users by demographics (2007-2022)

Source: RBA, Cash Use and Attitudes in Australia, 2023, p 32.
Data from the Bank of Canada from 2021 demonstrates similar demographic trends in cash use in Canada to Australia, across ages and income levels. As the table below shows, both cash payments and receipts in cash are highest in the cohorts which are the most elderly, lowest income, lowest education and lowest financial literacy. The characteristics of the groups with a higher propensity to use cash suggests that vulnerable groups in society could be at risk of harm as we move towards an increasingly cashless society.
Cash usage and cash income data from Canada, by demographics (2021)
| Cash volume payment share (%) | Received payment in cash in the last week (%) | ||
|---|---|---|---|
| Age | 18-34 | 20.1 | 6 |
| 35-54 | 16.6 | 3 | |
| 55+ | 26.2 | 2 | |
| Income (CAD) | $45k | 28.8 | 5 |
| $45k-$85k | 22.8 | 4 | |
| $85k+ | 18.7 | 3 | |
| Education | High school | 26.3 | 4 |
| College | 21.4 | 4 | |
| University | 15.3 | 3 | |
| Financial Literacy | Low | 26.3 | 6 |
| Medium | 24.7 | 3 | |
| High | 19.0 | 3 |
Source: Henry, C. S., M. Shimoda and J. Zhu. 2022. “2021 Methods-of-Payment Survey Report.” Bank of Canada Staff Discussion Paper No. 2022-23, p 41, 48
With respect to use of cash by businesses, there is poor evidence on their cash usage. Anecdotal evidence suggests that small businesses and sole traders are likely to be the most intensive users of cash.
What does the future hold for cash in Australia?
The decline in cash use, together with a broader shift towards digital banking, poses a range of challenges. As can be seen in the figure below, key locations where people can access cash* has almost halved over the period FY2017 to FY2024. Based on Frontier Economics analysis of this data for FY2017 to FY2024, around 1.3 million people were no longer within 3km of a bank in major cities or 5km in regional and remote areas. This figure falls to around 500,000 people over the same period when taking into account banks, Bank@Post or ATMs**.
Key locations to access cash
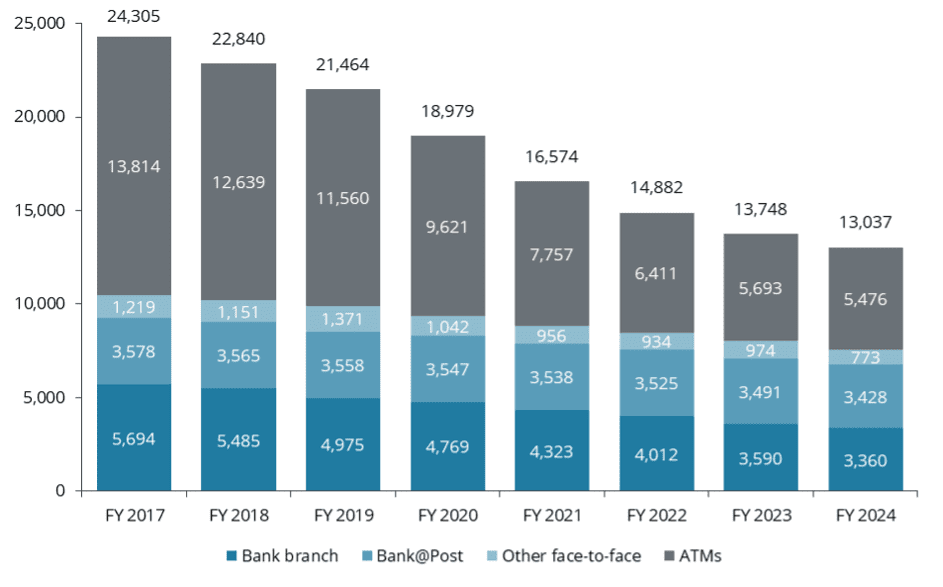
Source: Frontier Economics analysis of APRA data
The issue of declining cash use and associated issues is not unique to Australia. It is notable, however, that no country has gone entirely cashless. In Sweden, one of the least cash dependent countries in the world, the central bank recently supported a proposal to “introduce an obligation to accept cash in the sale of essential goods, and to strengthen banks’ responsibility for cash handling.” (Riksbank, June 2025) Similarly, the Australian Government has proposed mandating cash acceptance for businesses selling “essential items.” (The Australian Government Treasury, December 2024)
As such, it appears that we may be heading for a low cash future rather than a cashless future.
* Noting that some retail outlets offer ‘cash back’ which is not included in this dataset
** Frontier Economic analysis based on spatial analysis of APRA data overlayed with Australian Bureau of Statistics (ABS) population data at a mesh block level. Major cities are defined as per the ABS remoteness structure
What has been done elsewhere? The case of cheques in Australia
In some ways cheques are a good example of policy making around a declining payment mechanism. Australia is winding down their cheques system before 2030. It is notable that cheques have much lower usage than cash, accounting for less than 0.1% of the total volume of retail payments in Australia. (The Australian Government Treasury, 2024, Cheques Transition Plan: Winding down Australia’s cheques system)
As part of the transition, the Australian Government expects that “All customers that use cheques will be supported to transition to readily accessible alternative payment methods.”
It is not exactly clear what this expectation entails in practice, presumably a large focus is assisting people to digital payment methods with cash being an alternative option for those that are digitally excluded. This would be harder to replicate if transitioning away from cash, as there would only be digital payment options which does not work for the digitally excluded, which have been estimated at nearly one in four Australians. (Commonwealth of Australia, May 2024, Bank closures in regional Australia). Perhaps this is why the future of cash is a problem that policy makers are still grappling with.
Monthly cheque volume decline over 20 years (‘000)
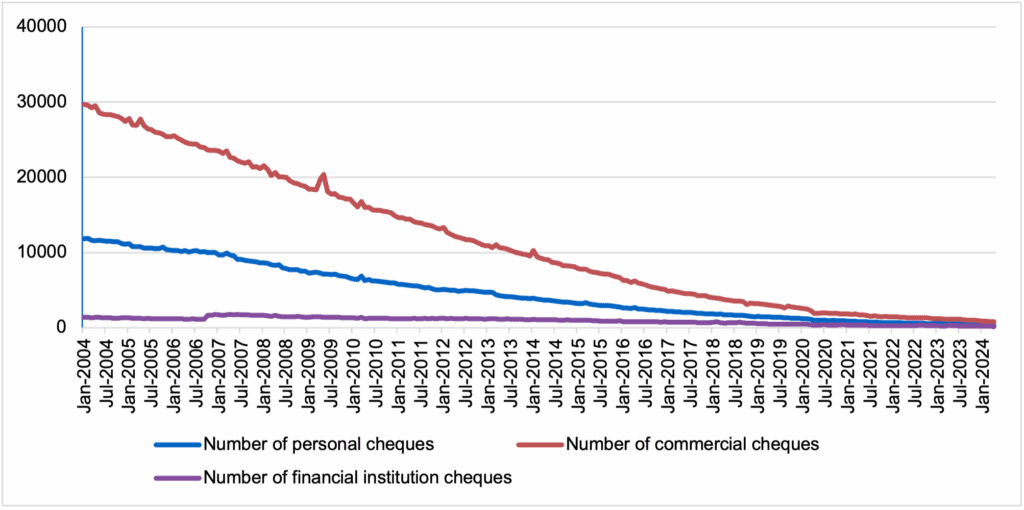
Source: The Treasury, Cheques Transition Plan, 2024, p 2 / Reserve Bank of Australia Statistical Tables
Relatedly, there are challenges in the cash in transit sector. The two biggest firms in the sector – Armaguard and Prosegur – merged in 2023. The merger was intended to make cash in transit services more viable in the face of declining demand. However, in June 2024 it was necessary for the merged entity to obtain around $50 million of financial assistance from their eight largest customers to continue to operate for a further 12 months (Australian Banking Association, June 2024). An extension of $25.5 million funding to cover July to December was recently announced in a joint statement by the Australian Banking Association and Armaguard Group.
The area of cash distribution in Australia is rapidly evolving with the Council of Financial Regulators and Australian Competition and Consumer releasing a consultation paper on regulating cash distribution in July 2025. This paper includes proposing that a regulator and/or Minister be given powers to specifically regulate cash distribution entities “who provide critical cash services to a significant part of the market”, i.e. Armaguard. It also proposes these regulations include emergency powers including an ability to change management and/or transfer a business in crisis. The reason for proposing quite interventionist regulation links back to the importance of cash distribution for maintaining access to cash.
The role of a policy response
Australia’s sheer geographic size makes maintaining provision of cash especially challenging. In economic terms, the challenges can be characterised by relatively high fixed costs of distributing and storing cash and a declining customer base from which to recoup these costs. This appears to be an area which requires a clear public policy response across the cash services sector. As cash services become increasingly uneconomic, it is important to be clear what role cash should have in the Australian economy, whether there should be universal access to cash and, if not, what should be done to support users, particularly vulnerable groups, who will find it hard to transition away from cash?