At Frontier Economics, our work in financial economics often touches on how ESG ratings are used in investment decision making. These ratings vary widely across providers, with no industry-wide standard for the methodology or measurement. This raises an important question:
How much confidence can investors place in ESG ratings, and is there a better approach?
This piece looks at how ESG ratings compare across two leading providers, whether they offer an objective indicator of sustainability performance, and whether they can in and of themselves reliably support investment decisions.
What are ESG ratings?
ESG ratings condense a company’s environmental, social and governance performance into a single score. At face value, they appear to offer clear, actionable information for investors. ESG ratings are also used by companies to support stewardship claims and demonstrate alignment with sustainable finance objectives.
However, determining an ESG rating is both complex and inherently subjective. Providers assess different risks, opportunities and management practices, and apply their own frameworks for measurement, weighting and aggregation. In Australia, several providers issue ESG ratings using a distinct methodology, producing different results.
How do ESG ratings compare between providers?
To illustrate this variation, Figure 1 below compares the ESG ratings for ASX 200 companies (as of 27 June 2025) from two major providers, LSEG (Refinitiv) and Sustainalytics.
Each dot shows a company's ESG rating from both systems. If the ratings align closely, the points would cluster along the diagonal red line. Instead, the scatter is wide: differences between the two ratings frequently exceed material thresholds, with the largest gap reaching 44 points.
Figure 1: Normalised LSEG ESG ratings versus Sustainalytics ESG ratings for 2025 ASX200 constituents
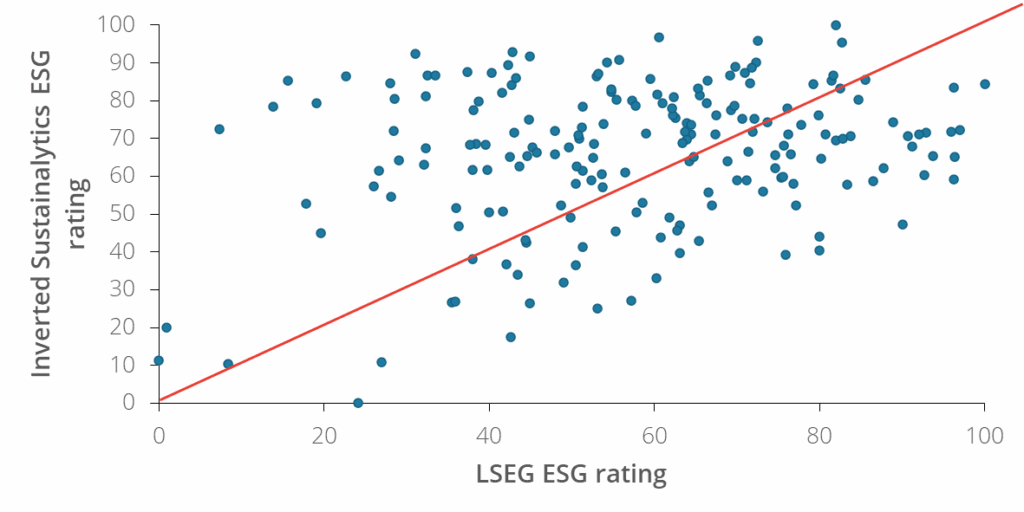
Note: Sustainalytics ESG ratings have been inverted so that they are on the same orientation as the LSEG ESG ratings
But even if the absolute scores differ, do the providers at least agree on the relative ranking of companies? To test this, we calculate the correlation between the two providers’ ESG ratings. The result is 0.15 which indicates a very weak relationship. The highest and lowest ranked companies under each provider (Figures 2 and 3) also differ substantially, reinforcing the point that relative ordering is not preserved.
Figure 2: LSEG and Sustainalytics highest ranked ESG constituents in the ASX200
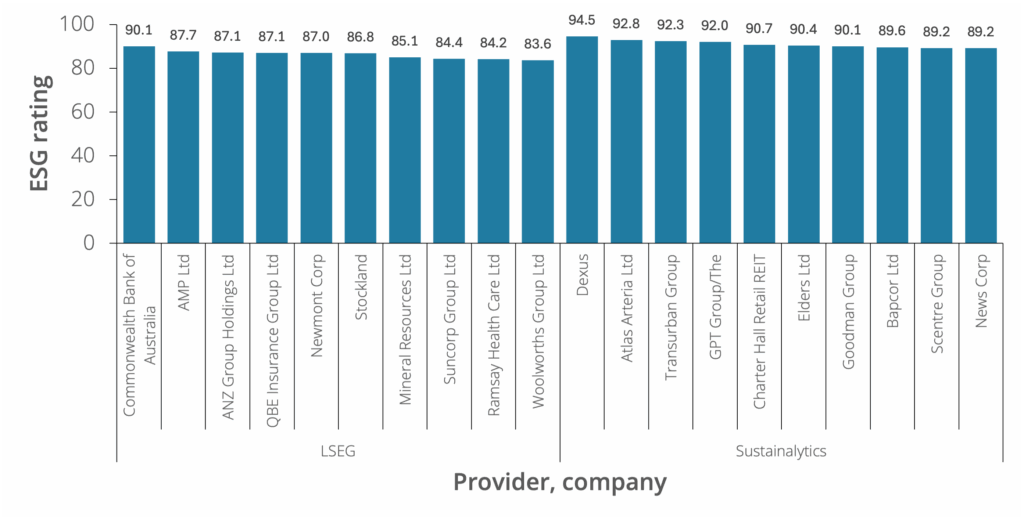
Note: Sustainalytics ESG ratings have been inverted so that they are on the same orientation as the LSEG ESG ratings
Figure 3: LSEG and Sustainalytics lowest ranked ESG constituents in the ASX200
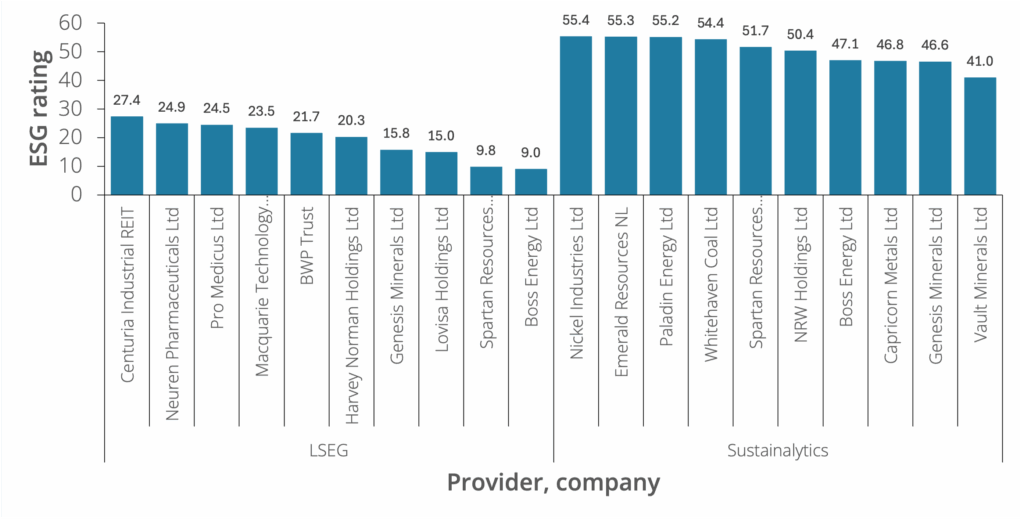
Note: Sustainalytics ESG ratings have been inverted so that they are on the same orientation as the LSEG ESG ratings
This lack of alignment raises concerns about the consistency and reliability of aggregated ESG information. For investors, these inconsistencies make it difficult to discern a company’s true sustainability performance, increasing the risk of misallocated capital.
Is there an alternative approach to ESG ratings?
Given the diversity of business models, sectors and geographies, it is difficult, and perhaps impossible, to design a single ESG rating methodology that robustly captures sustainability performance across all firms.
This suggests the need to look beneath the headline ratings and:
- Scrutinise underlying methodologies and disclosures;
- Use multiple providers to mitigate divergence; and
- Supplement ratings with regulatory requirements, such as mandatory climate reporting and the Australian Sustainability Reporting Standards (ASRS).
Without a consistent regulatory framework for ESG ratings themselves, aligning capital flows with sustainability objectives remains challenging.
Australia’s Sustainable Finance Taxonomy
Australia’s Sustainable Finance Taxonomy was officially released by the Australian Sustainable Finance Institute (ASFI) on 17 June 2025. It provides a voluntary, science-aligned classification framework for ‘green’ and ‘transition’ economic activities tailored to Australia’s context.
The taxonomy covers six priority sectors:
- Electricity generation and supply;
- Minerals, mining and metals;
- Construction and the built environment;
- Manufacturing and industry;
- Transport; and
- Agriculture and land.
It also includes Do No Significant Harm criteria to ensure aligned activities don’t undermine other environmental objectives, and Minimum Social Safeguards to uphold basic social protections.
ASFI is now piloting the taxonomy with major financial institutions to test real-world use. The taxonomy remains voluntary, but it aims to improve transparency, reduce greenwashing, and direct private capital toward climate-aligned economic activity.
Evidence from Europe demonstrates the potential impact. A 2025 study by Bassen, Kordsachia, Lopatta and Tan found that, following introduction of the EU Taxonomy, investors placed higher value on companies whose revenues aligned with it, suggesting the taxonomy was viewed as a more credible sustainability indicator than traditional ESG ratings.
Looking ahead
Sustainable finance decision-making remains complex. ESG ratings provide useful information, but their inconsistencies mean they should not be relied upon in isolation. Robust evaluations require in-depth economic analysis of companies, sectors and operations, supported by credible regulatory frameworks.
As Australia progresses its sustainable finance reforms, investors will have more consistent, transparent tools to assess sustainability performance. These developments are essential for directing capital toward genuinely sustainable economic activity.