Revenues for mobile services in Australia have been falling for years, and this is beginning to place pressure on new investment in mobile networks. At the same time, a wave of spectrum licences — an essential input to mobile services — are due for renewal, the OECD has argued that a fourth entrant in the Australian market should be encouraged by policy makers, and there are ongoing pressures to improve coverage, service quality and network resilience.
In this article, we identify the critical investment challenges that must be addressed to deliver the next wave of mobile services, and we highlight why investment requires difficult conversations between policy makers, investors and customers.
Real revenue reductions in the mobile sector
For many years, mobiles were the darling of the telecommunications sector in Australia. Between 2010 and 2020, Australia’s mobile sector ranked among the stronger performers globally, particularly on coverage, speeds and early adoption of 4G then 5G, especially once 4G was fully built out in the mid‑2010s.
Over the last decade, Australia’s mobile operators have experienced a marked decline in real revenues—revenues adjusted for general inflation—even as data demand has exploded and expectations for coverage, speed and reliability have ratcheted up. 5G has clearly not delivered the revenue bump that was hoped for; rather, mobile services have become increasingly commoditised amid sustained competitive pressure and consumer’s willingness to trade off price for quality.
After inflation adjustment, mobile revenues for Telstra, Optus and TPG Telecom (which absorbed Vodafone Hutchison Australia’s mobile business) have been falling since around 2015, with the sector now earning significantly less in real terms than it did a decade ago (Figure 1).
Figure 1: Mobile industry revenues, real $2025
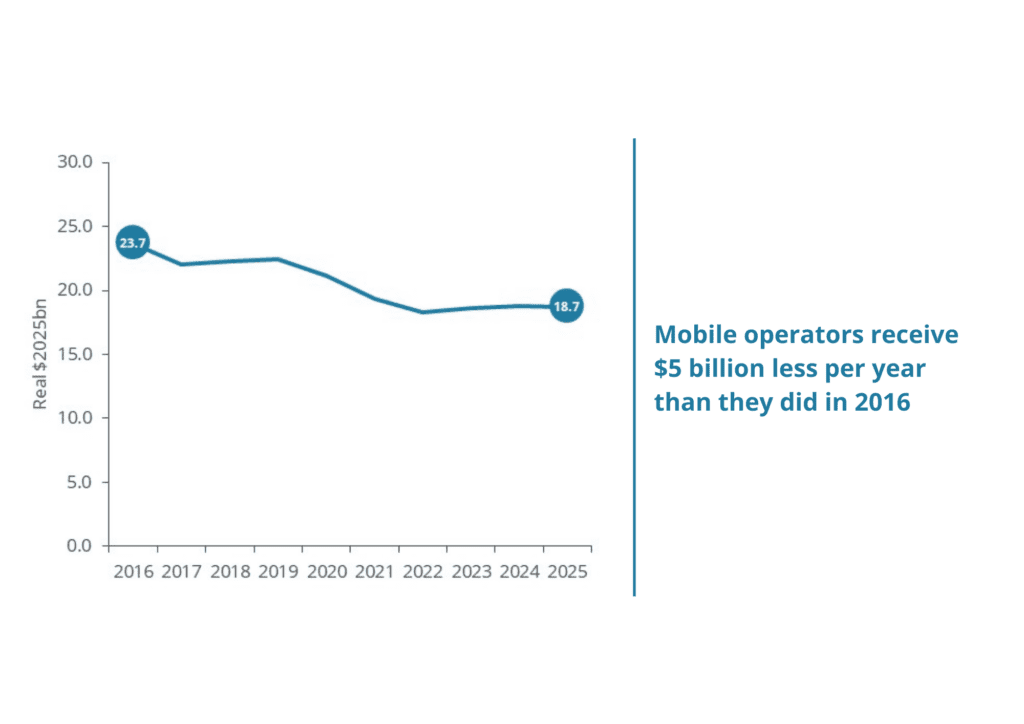
Source: Frontier Economics calculations, Telstra, Singtel Optus, TPG and NBN Co annual reports
A concern with falling revenue might potentially be tempered by evidence of lower capital costs. But the data says the opposite is likely to be true – Australian Bureau of Statistics (ABS) indicators suggest that we are seeing a combination of higher capital costs and falling prices (Figure 2).
Figure 2: Costs vs prices
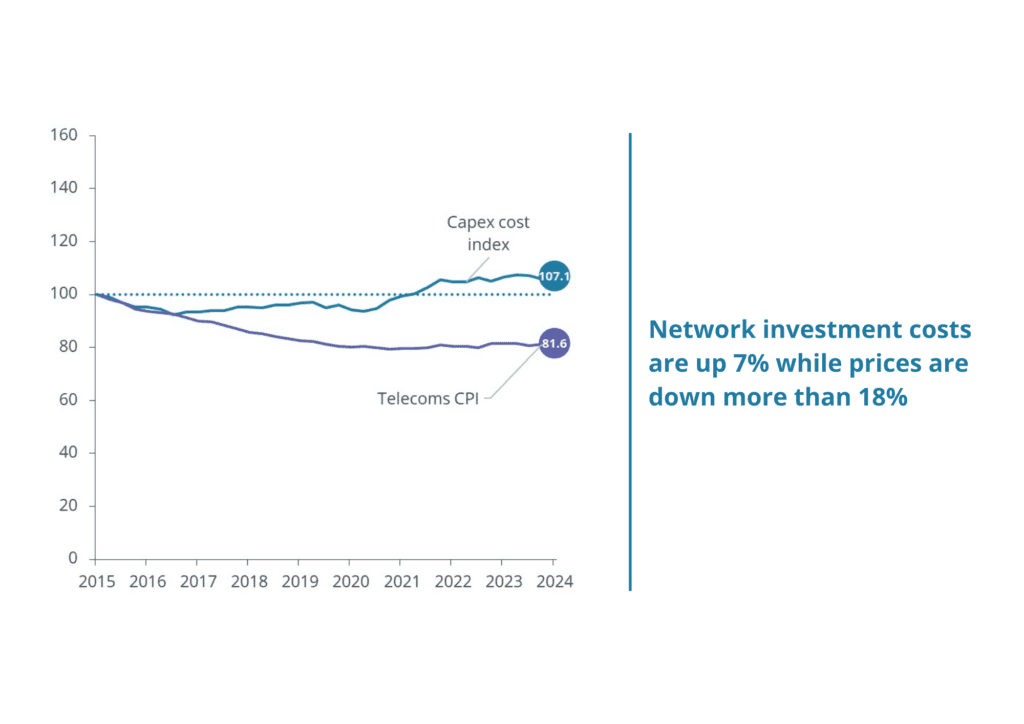
Source: Frontier Economics calculations based on ABS data [1]
The implications for private investment in mobile networks
Although none of the mobile operators produce standardised data that would allow easy comparisons to be made over time, our analysis of past financial reports suggests that investment in mobile networks has remained strong. One interpretation of this data might be that competition is doing its job. Competition between the mobile networks could result in service quality improvements and sustained investment even with lower revenues.
The main question is the sustainability of this environment. In the long run, revenues are inextricably linked to new investment. And although the first phase of the 5G network cycle occurred from 2019, pressures to maintain and increase investment continue to emerge. In particular:
- Data growth: mobile data continues to grow rapidly, with Australian Competition and Consumer Commission (ACCC) data indicating that volumes have increased by more than 25% per year over the last 5 years. This puts pressure on investments to densify networks, make greater use of higher-bandwidth spectrum (e.g., mmWave) and upgrade core networks and backhaul links.
- Addressing the regional divide: Substantial additional spend is required to densify networks, extend better quality services deeper into regional Australia.
- Network resilience: Operators are also being pushed to deliver more resilient networks that can withstand fires, severe storms, floods and prolonged power outages – and mobile operators will soon be under a universal coverage obligation.
Where is the next round of investment coming from?
Falling real revenues have big implications for mobile network investment decisions:
- Less financial headroom: the economics of new projects becomes much tougher when every dollar of revenue buys less in real terms, yet construction and equipment costs have risen by nearly 30% since 2016.
- Tougher trade‑offs: management must choose between maintaining basic capacity to keep up with traffic growth or stepping up to the higher‑cost upgrades needed for advanced 5G use cases, regional equity and resilience.
- Greater reliance on external support: in marginal areas – regional backhaul, resilience projects, or deep rural coverage – shrinking real revenue pools make it increasingly unlikely that private investment alone will deliver what governments and communities expect.
- Fewer opportunities for market entry: the OECD has recently argued that the entry of a fourth mobile network could be encouraged via infrastructure sharing and spectrum reform. Yet entry by a fourth mobile operator seems much more plausible where revenues are growing (or falling less than costs). Such dynamics improve the expected net present value of investing in spectrum and infrastructure, and reduce the risk that the entrant will be trapped with an unviable cost base.
As shown in Figure 3, there is an unsurprising correlation between mobile revenues and mobile network investment in markets around the world. Once Australia’s higher network costs from its challenging geography are taken into account, the risks of falling behind peers in mobile infrastructure investment become even more glaring.
Figure 3: The relationship between revenues and investment (2024)
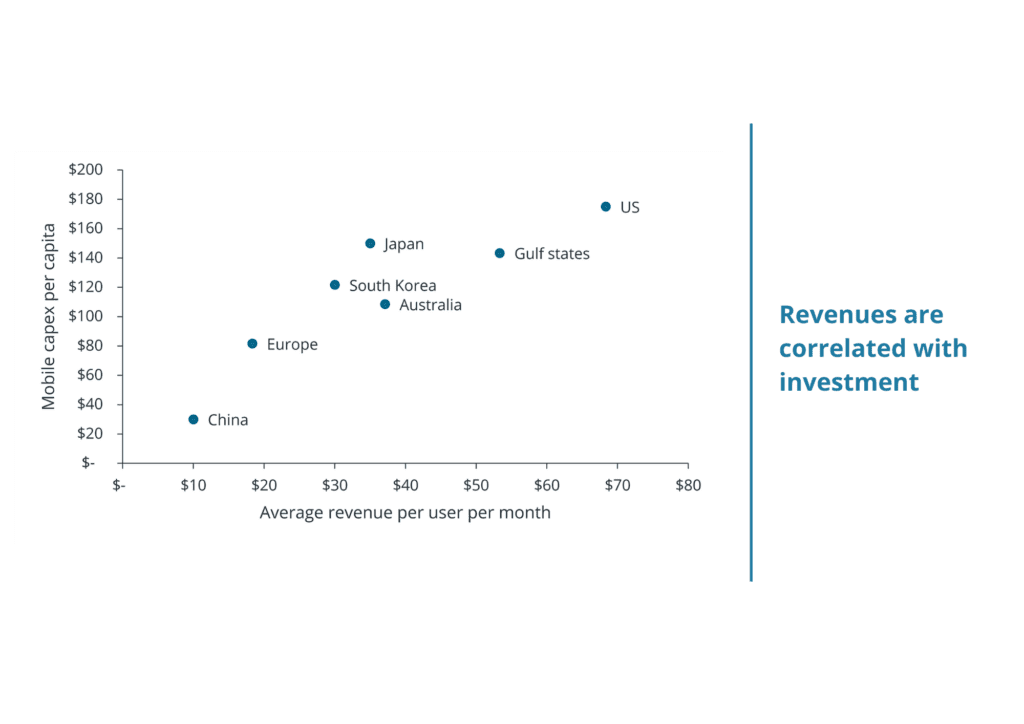
Source: GSMA data, Frontier Economics analysis
So, what next for mobile networks?
It is not all bad news for investment in telecoms as a whole. The available data suggests that:
- there is still growth in private telecoms investment in data centres and associated connectivity, highlighted by the latest ABS data noting a strong rise in equipment and machinery capex in the information technology sector – with growth of 40 per cent over the last 18 months; and
- NBN Co has invested more than $17 billion between 2024 and 2024, and, supported by its government shareholders, will likely continue to invest further in its network to meet defined policy goals (NBN Co Annual Reports Data).
Nonetheless, we expect the result of continued revenue stagnation will be a growing tension between the Government’s policy ambitions and the commercial reality that telcos can only sustainably invest out of what customers are willing to pay in real terms. It will become impossible to sustain historical levels of investment, let alone fund the step‑change needed for high‑performing, resilient 5G and future 6G networks.
Currently, the mobile investment debate is focused on spectrum licence renewal prices, but this is merely the start of the conversations that need to be had between policymakers, investors and customers about:
- the barriers to lowering costs of network deployment;
- how spectrum and regulatory settings affect the case for investment; and
- whether targeted public co‑investment or smarter incentives are needed to unlock projects that will never clear a private hurdle rate but are critical for Australia’s digital ambitions.
[1] We constructed a composite cost index consisting of a 60% share for Heavy and civil engineering construction and a 40% share of Telecoms equipment (import price index). The shares are based on industry standard breakdowns for new capex.