
The Australian Accounting Standards Board has introduced the Australian Sustainability Reporting Standard for climate-related disclosures, known as AASB S2. In-scope entities must now prepare a sustainability report under the Corporations Act as part of their annual reporting package, and AASB S2 sets out what that report must disclose about climate-related risks and opportunities. Previously, these disclosures were voluntary.
The standard is intended to give investors, lenders and other users clearer and more consistent information about climate-related exposures and their financial implications. Responding to climate risks involves complex trade-offs, and economic analysis provides a structured way to weigh them and support evidence-based decisions.
This article outlines what has changed under AASB S2 and uses a case study on extreme heat risk to show how economic tools such as cost-benefit analysis, scenario analysis or real options analysis can support the process.
Implementation and development of climate-related financial disclosures
AASB S2 shifts Australian climate reporting away from voluntary frameworks, such as the Task Force on Climate-related Financial Disclosures (TCFD), towards mandatory and more consistent disclosure requirements. In August 2026, the Commonwealth Treasury also released voluntary guidance on climate-related transition planning. The guidance supports businesses’ transition planning, but it does not address the requirements for disclosing transition plans under the mandatory regime.
AASB S2 disclosures go beyond identifying climate risks and require businesses to consider:
- physical and transition risks;
- the current effect of climate risks on financial position, performance and cash flows;
- the effect of climate risks on investment planning and appraisal;
- the anticipated financial effects of climate risks in future periods;
- scenario analysis to test their climate resilience; and
- how climate-related effects are communicated to investors, lenders and other users of financial reports.
Reporting is already under way
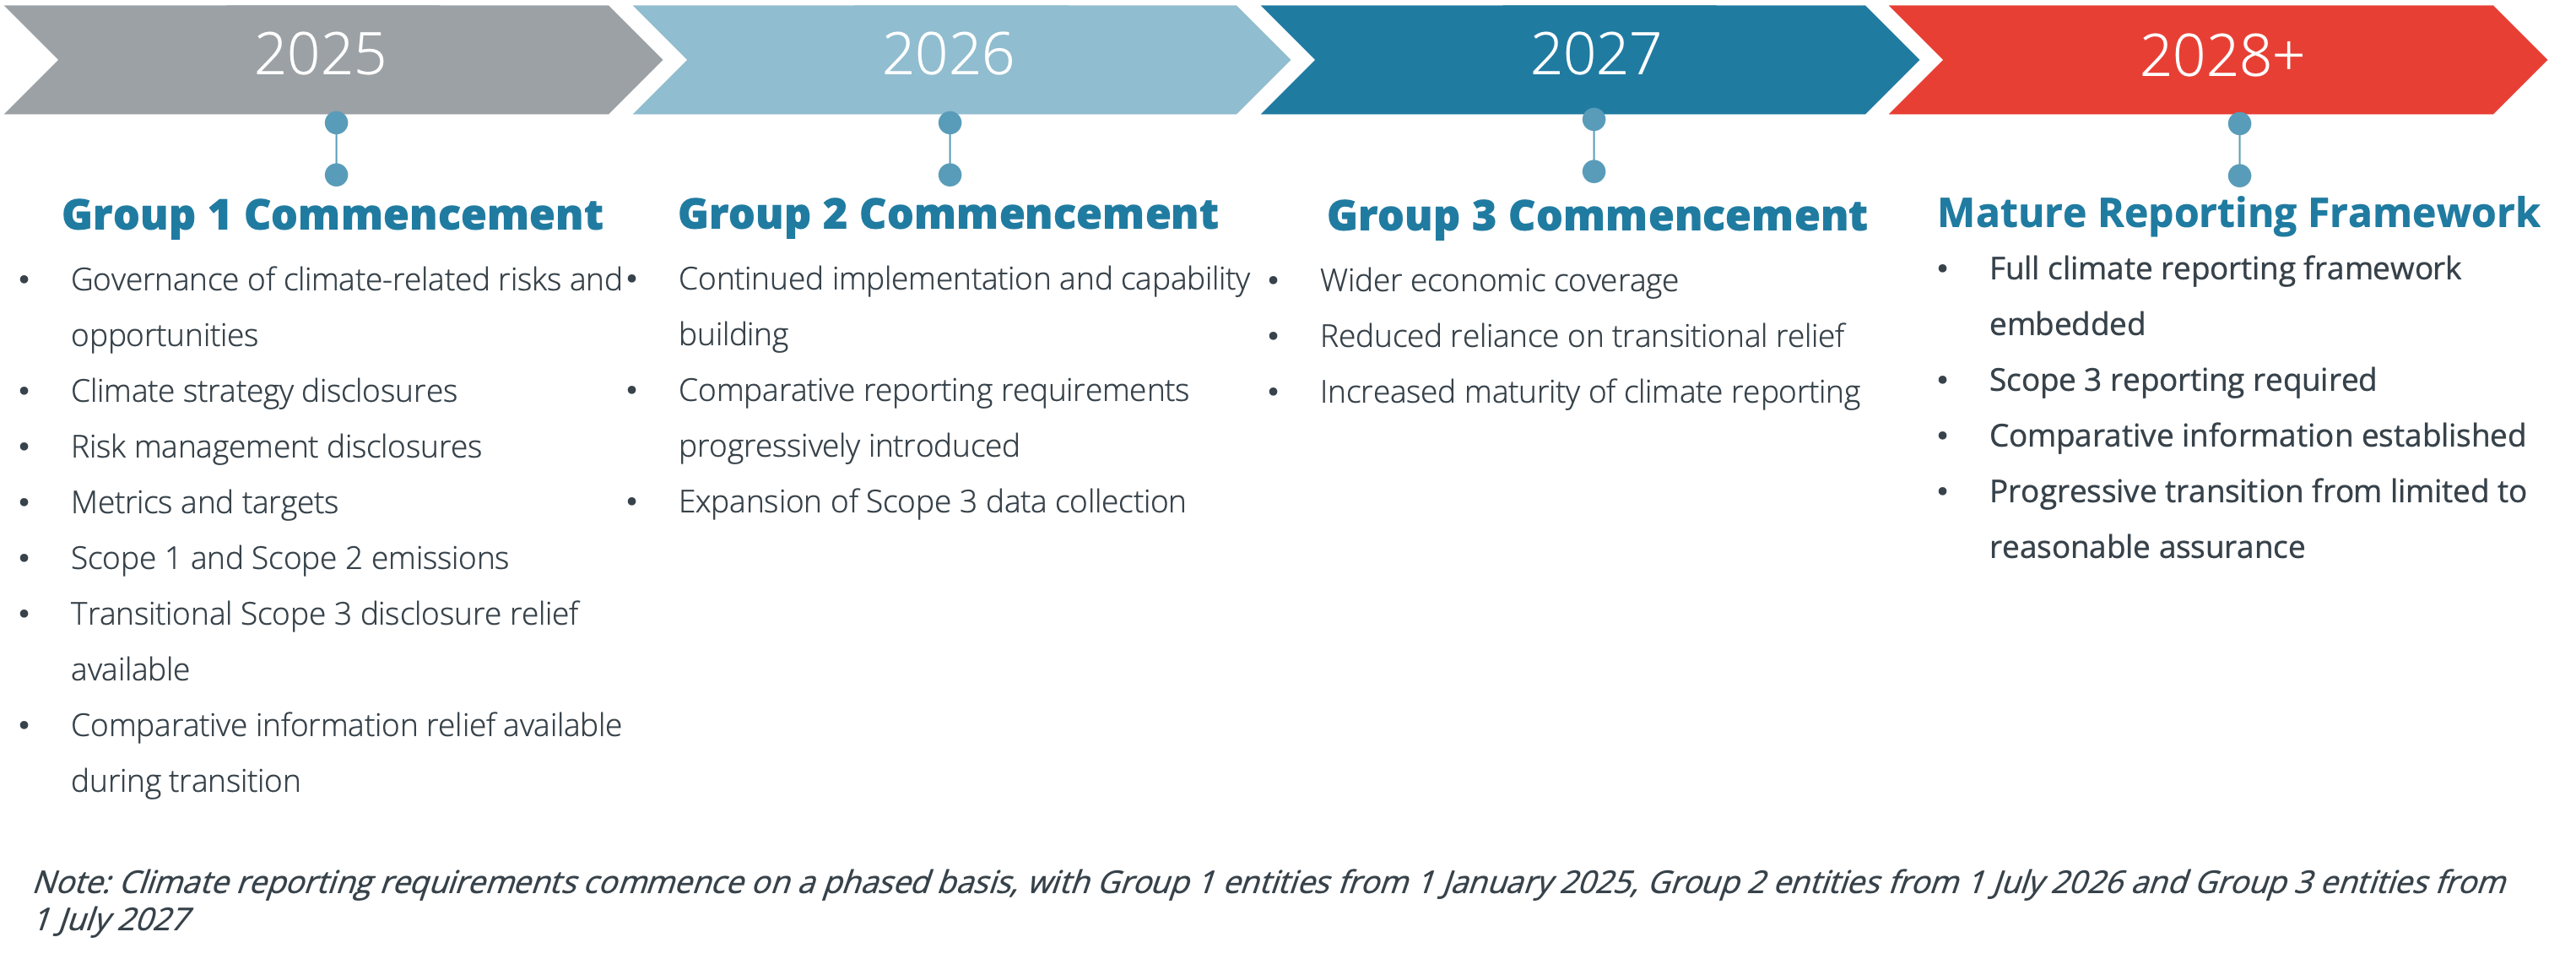
Reporting is phased in across three groups, based mainly on size. See below in Figure 1, the timeline for climate-related financial reporting.
Entities meeting two of three thresholds for revenue (R), assets (A) and employees (E) fall into:
- Group 1: R: $500 million, A: $1 billion, E: 500,
- Group 2: R: $200 million, A: $500 million, E: 250, or
- Group 3: R:$50 million, A: $25 million, E: 100.
- Large emitters and asset owners join Group 1 or 2 regardless of size.
AASB S2 has applied to Group 1 entities for financial years beginning on or after 1 January 2025 and to Group 2 entities for financial years beginning on or after 1 July 2026. Group 3 entities follow for financial years beginning on or after 1 July 2027.
Group 1’s first reports show how entities used the transitional relief available in their first year of reporting under AASB S2. In that year, entities do not have to provide comparative information for the previous year. They also do not have to disclose Scope 3 greenhouse gas emissions, which are the indirect emissions across a company’s value chain, such as those from purchased goods, business travel and customers’ use of sold products. Scope 3 disclosure becomes mandatory from the second reporting year.
PwC’s review of the first 22 Group 1 reports found that all but two companies used the relief for comparative information. Most also used the Scope 3 relief, although 12 voluntarily disclosed some Scope 3 categories.
As climate risks and reporting frameworks evolve, businesses will need to revisit their assumptions more often and explain how they assess adaptation, resilience and transition options.
Figure 1: Climate-related financial reporting timeline
Source: Australian Government Treasury, Climate-related Financial Reporting and Guidance; Australian Accounting Standards Board, AASB S2 Climate-related Disclosures (September 2024); Auditing and Assurance Standards Board, ASSA 5010 Timeline for Audits and Reviews of Information in Sustainability Reports under the Corporations Act 2001.
Using economic analysis to make an informed investment decision and support disclosure
In broad terms, firms can adapt, accept or retreat in response to climate risks. These options have different costs, timing and risk implications. Determining the preferred approach requires a well-structured analysis that identifies the option, or combination of options, most likely to deliver the best outcome for the company.
Analysis tools
AASB S2 does not require an entity to quantify the anticipated financial effects of climate-related risks and opportunities if it lacks the skills, capabilities or resources to do so. The entity can describe those effects qualitatively instead. Even so, the investment decisions behind those effects still need an evidence base.
Three economic tools can help businesses connect climate risk assessment with AASB S2 disclosure: cost-benefit analysis, scenario analysis and real options analysis. Each tool builds on the one before and supports a different disclosure need.
Cost-benefit analysis (CBA) sets the base case by estimating whether an adaptation investment has a positive net present value, and provides the quantitative estimate of anticipated financial effects that AASB S2 asks for;
Scenario analysis then tests whether that result holds across different warming outcomes, and supports the climate resilience assessment AASB S2 requires; and
Real options analysis values the flexibility to stage or delay investment where the result depends on the scenario, which helps avoid both under-investment and over-investment, and supports disclosure of how climate risk affects strategy and investment plans.
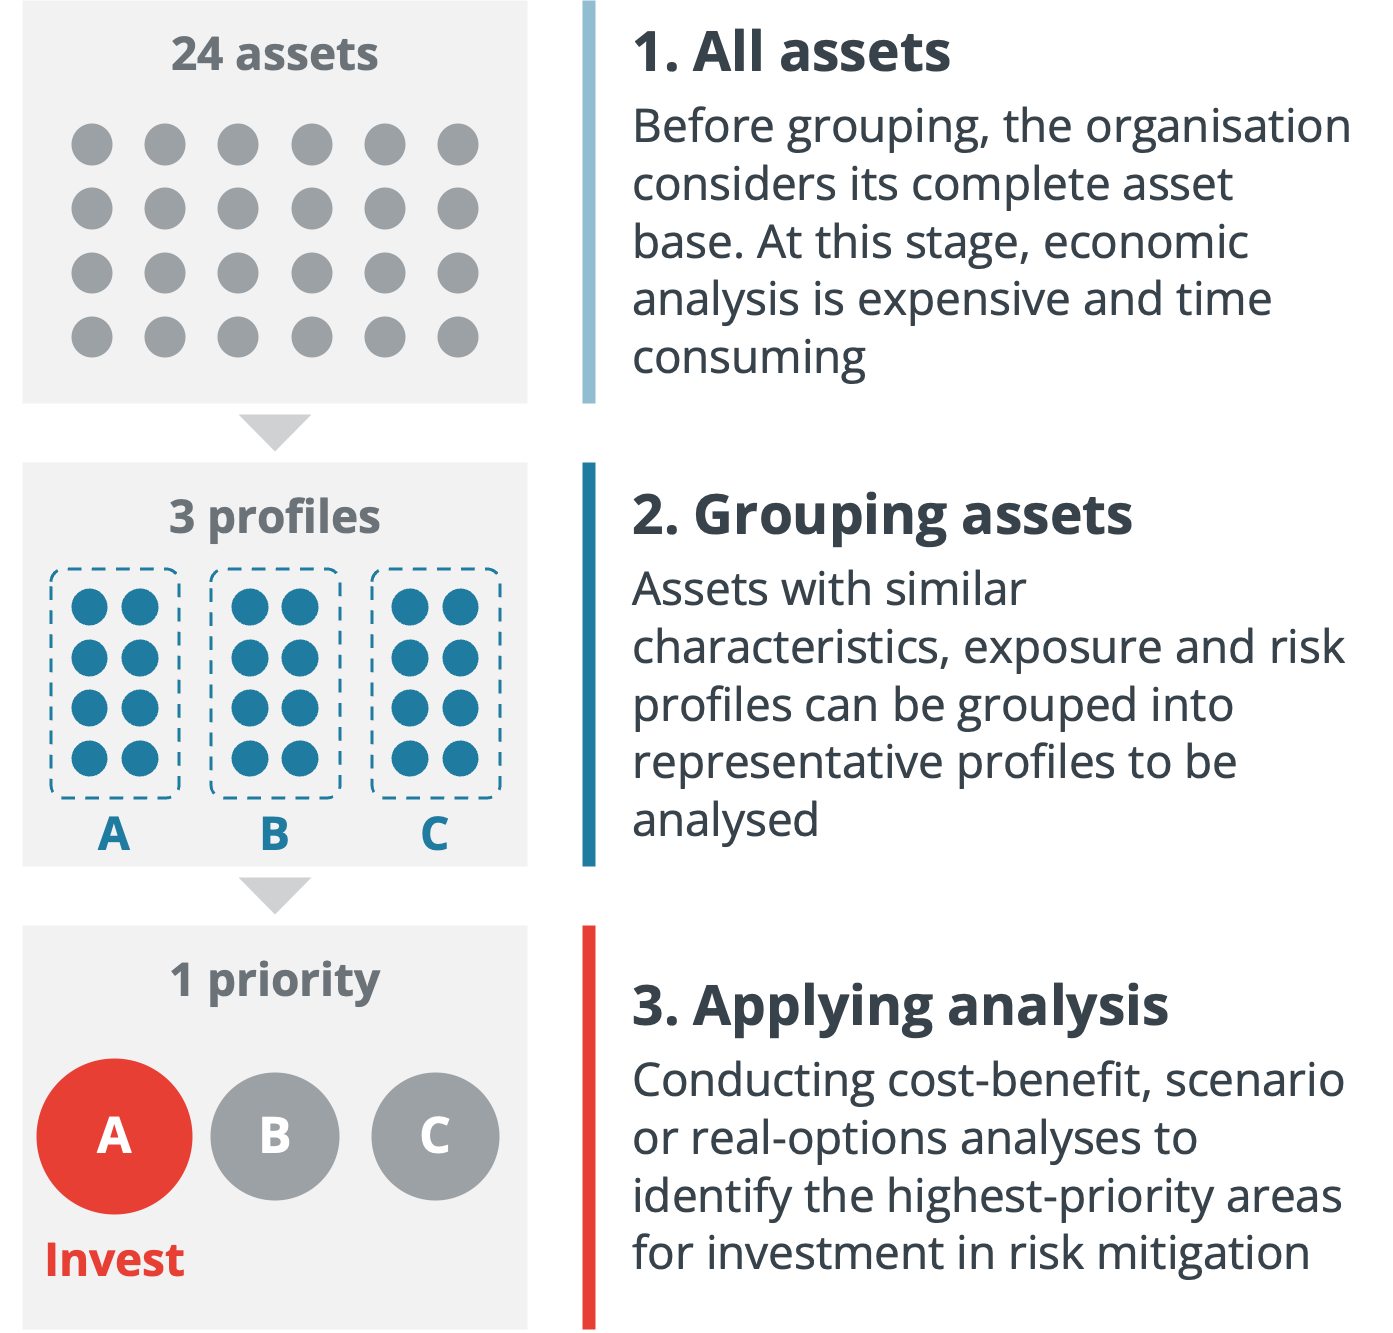
For organisations with large and geographically dispersed asset portfolios, applying these methods at every individual site would be time-consuming and costly. Our experience shows that a more effective approach is to group assets with similar characteristics, exposures and risk profiles into representative categories.
For example, as described in Figure 2 below, retail centres located in high heat-risk areas may be assessed as a single group rather than individual centres. Economic analysis can then be undertaken on representative asset groups to identify the most appropriate adaptation response and estimate the likely costs and benefits across the broader portfolio.
Figure 2: Steps to apply economic analysis
Source: Frontier Economics
Case study: Using economic analysis to assess extreme heat risk for real estate assets
Issue: Extreme heat risk (days with a temperature over 35 degrees Celsius)
Under AASB S2, in-scope entities, including those with real estate assets, must disclose climate-related risks and opportunities that could reasonably be expected to affect their cash flows, financial position and access to finance or cost of capital.
Financial risks from extreme heat under business-as-usual conditions
It has been suggested that the number of days over 35 degrees Celsius experienced each year could double by 2050, for nearly one third of Australian communities. As a result, real estate companies may identify extreme heat as a material physical climate risk.
This growing climate risk could affect real estate companies in several financial ways, including higher cooling costs from greater use of heating, ventilation and air-conditioning (HVAC) systems, lower foot traffic and staff productivity from heat stress, and reduced asset value in locations with higher heat exposure.
Types of interventions that could be adopted for extreme heat
Businesses facing extreme heat risk could consider several responses:
Option 1: Building efficiency upgrades, which may include upgrading HVAC systems, improving insulation and changing façades.
Option 2: Nature-based cooling solutions through increased tree canopy surrounding the building or expanding shaded public areas.
Option 3: Asset improvement through redevelopment of highly exposed buildings and designing new buildings to have higher climate-resilience standards.
Option 4: Reallocation of portfolio investment towards more resilient locations and away from highly exposed assets.
Option 5: A staged adaptation pathway that prioritises high-risk assets first, monitors climate outcomes and market conditions, and expands adaptation investment as risks materialise.
Options 1 to 3 are forms of adaptation, Option 4 is a form of retreat, and business-as-usual amounts to accepting the risk. Option 5 keeps the choice between them open until more is known. The worked example below, using illustrative figures, assesses two of these options against business-as-usual with the economic tools described above.
Worked example: Assessing climate adaptation investment under AASB S2
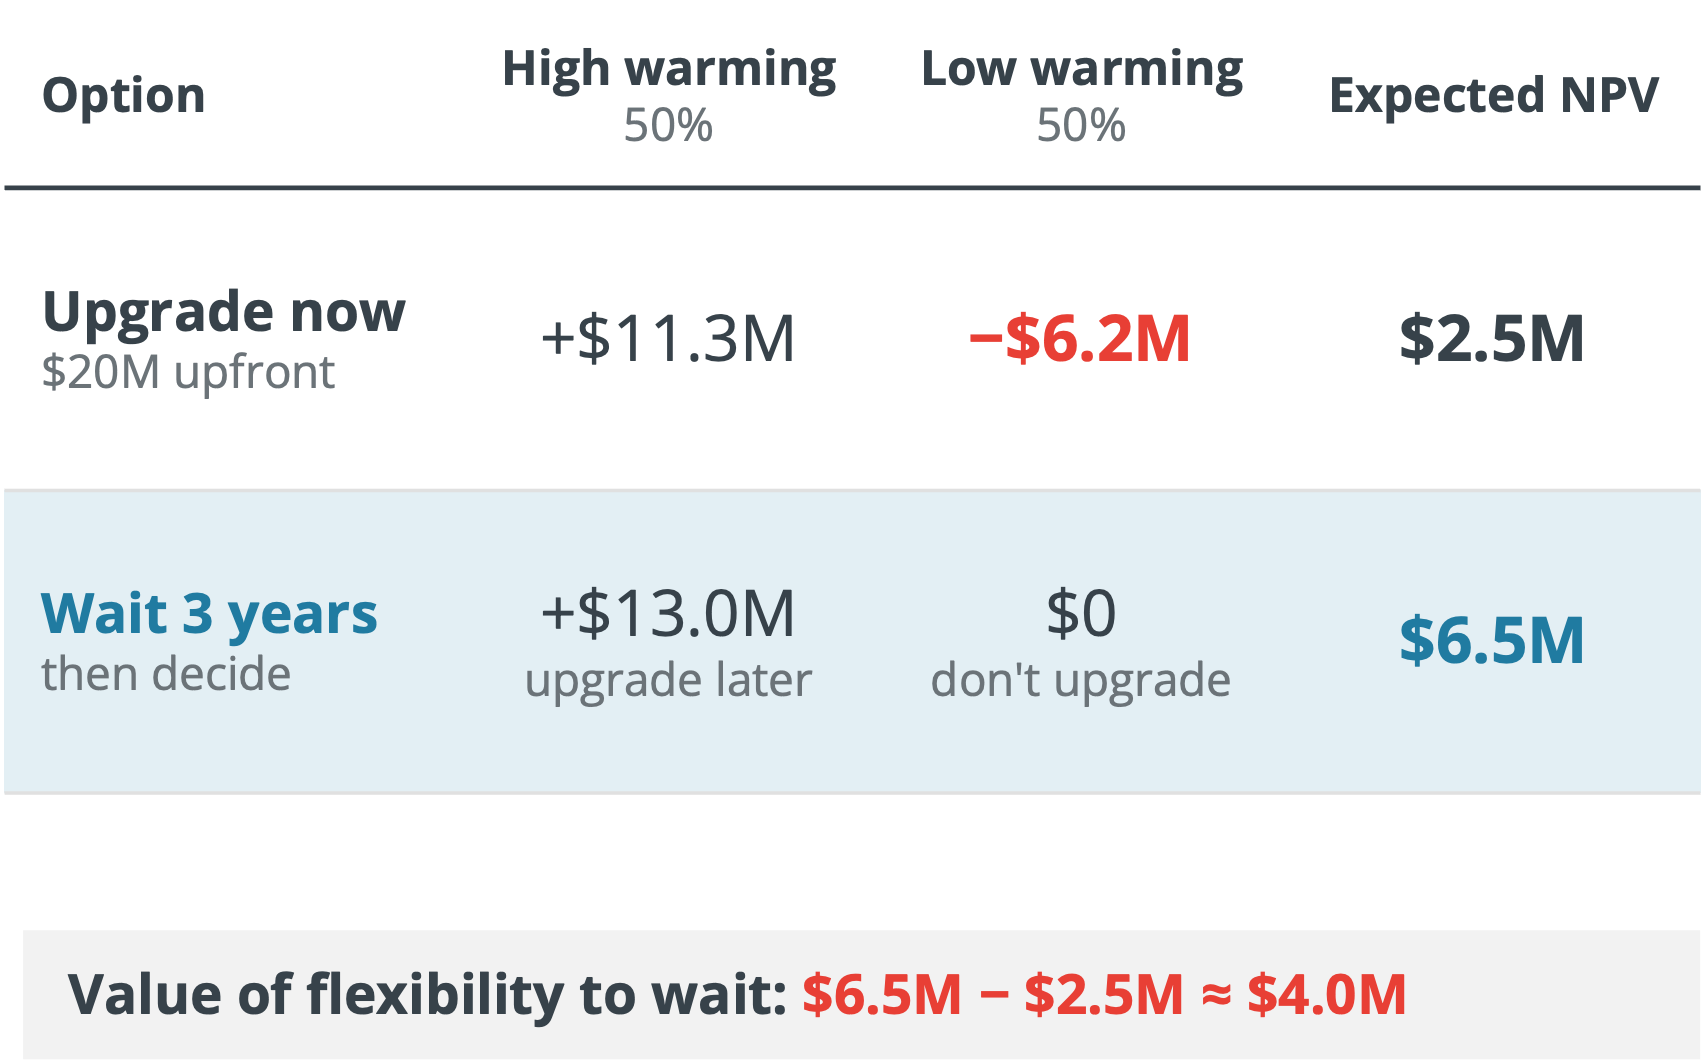
Consider ten retail centres in high heat-risk locations, grouped as one category. An HVAC and external shading upgrade across the group (Option 1) costs $20 million upfront and saves $1.6 million a year in cooling costs and heat-related tenant losses for the first three years. From year four the saving is $3.4 million a year under high warming and $1.2 million under low warming. The two scenarios are equally likely, and we assume the upgrade lasts 20 years from whenever it is installed and a 7 per cent real discount rate.
-
Cost-benefit analysis on the central projection, the average saving of $2.3 million a year from year four, gives a net present value of about $2.5 million, which on its own favours upgrading all ten centres now.
-
Scenario analysis shows the upgrade gains about $11.3 million under high warming and loses about $6.2 million under low warming, so the central estimate hides a material risk of over-investment.
-
Real options analysis values a staged pathway (Option 5), in which the company waits three years, when we assume the warming path is clearer, and upgrades only if high warming eventuates, giving up the savings in the first three years. This raises the expected net present value to about $6.5 million. The $4.0 million difference is the value of flexibility, which is large here because the upgrade is costly to reverse and the benefits are uncertain.
Figure 3 below shows a simplified version under two warming scenarios. Showing the relationship between upgrading now or waiting three years.
Each step supports a different AASB S2 disclosure, covering anticipated financial effects, climate resilience and how climate risk shapes investment plans. In practice the company could upgrade the most exposed centres now and decide on the rest, including nature-based cooling, in three years’ time.
Figure 3: Simplified upgrade decision under two warming scenarios
Economic analysis helps organisations turn climate risk assessment into practical AASB S2 disclosures. It can quantify anticipated financial effects, test whether investment decisions remain robust under different climate scenarios and show how flexibility changes the value of adaptation pathways. For companies with large asset portfolios, this can support clearer disclosures and more disciplined climate-related investment decisions.
Frequently asked questions: AASB S2 climate-related financial disclosures and economic analysis
What is AASB S2?
AASB S2 is Australia’s climate-related financial disclosure standard. It requires in-scope entities to report on climate-related risks and opportunities that could affect their cash flows, financial position, financial performance, strategy, business model and access to finance.
How can economic analysis support AASB S2 disclosures?
Economic analysis can help businesses quantify anticipated financial effects, compare adaptation options, assess climate resilience under different scenarios and explain how climate risk affects investment planning. This makes AASB S2 disclosures more evidence-based, decision-useful and transparent. At Frontier Economics, we use economic analysis, including cost-benefit analysis, scenario analysis and real options analysis, to support AASB S2 disclosures.
Why is scenario analysis important for climate-related financial reporting?
Scenario analysis helps businesses test whether an investment decision remains robust under different climate futures. For AASB S2, it can support disclosures about climate resilience by showing how physical and transition risks may affect financial performance, asset values and investment plans over time.
What role does cost-benefit analysis play in climate adaptation decisions?
Cost-benefit analysis compares the expected costs and benefits of different climate adaptation options. It can help organisations decide whether to invest, when to invest and which option is likely to deliver the greatest net benefit, while also supporting the financial estimates required for climate-related disclosures.
How does real options analysis help with uncertain climate risks?
Real options analysis values the flexibility to stage, delay or expand investment as new information becomes available. This is useful where climate risks are uncertain, adaptation costs are hard to reverse or businesses need to avoid both under-investment and over-investment.
Authors: Graham Phelan, Ben Mason and Natasha Kiers. Industries: Climate Change & Sustainability, Financial Services, Public Policy & Government. Expertise: Adaptation & Resilience, Biodiversity & Environmental Economics, Environmental, Social & Governance - ESG, Financial & Commercial Advisory.