
In brief: Our modelling of the National Electricity Market (NEM) shows that batteries have been effective at reducing today’s high-price events (periods when wholesale electricity prices exceed $300/MWh), which are largely caused by short, sharp peaks in early evening demand. By FY2040, however, the bigger risk will be peak residual energy demand – the energy needed when renewables output stays low for days. Batteries cannot meet this need because they store energy but do not create it. Of the options we tested using our proprietary energy42 model, gas peaking plants supported by adequate fuel supply provided the most effective and enduring long-term solution for the system.
Why summer peak demand has shaped electricity planning
Historically, much of electricity system planning in the National Electricity Market (NEM) has been about making sure there is sufficient capacity to meet peak demand, which often spikes for a few hours early evening on a hot summer day. That is why, while Australians enjoy the summer festivities, the Australian Energy Market Operator (AEMO), governments, and energy traders spend the season worrying that supply interruptions will spoil the fun – and push the system over its limit.
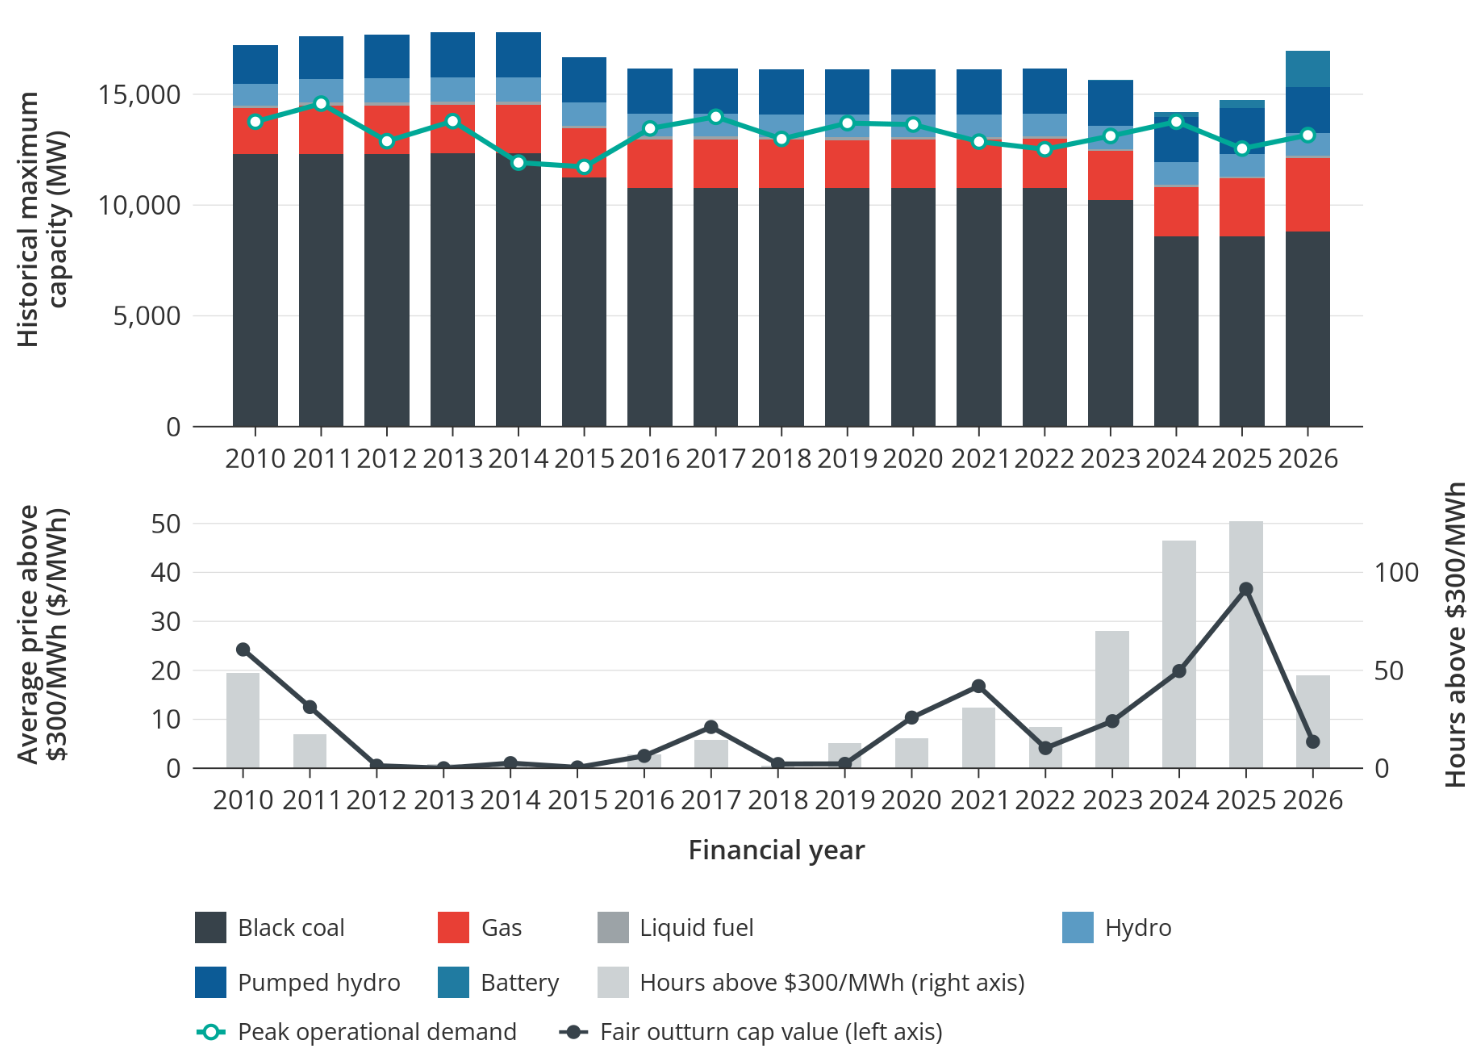
An analysis of historical cap events (i.e., periods when wholesale electricity pool prices exceed $300/MWh) reveals their relationship with peak demand and installed dispatchable capacity to date. Figure 1 below shows demand (red line) and dispatchable supply (stacked bars) in NSW at the top, and the total hours of cap events and fair cap value1 in real 2026 $AUD at the bottom2. The chart excludes the extreme market suspension period in winter 2022.
- Between FY2012 and FY2016, demand was declining, and generation capacity was abundant, so cap events were rare.
- This began to change in the late 2010s, as demand grew again and significant baseload capacity retired from NSW and the rest of the NEM.
- From FY2020, the number and value of cap events rose significantly, peaking in FY2025.
- Then, in FY2026, cap events dropped sharply in NSW and other NEM regions. This drop coincided with a sharp rise in installed battery capacity: approximately 1.5 GW of grid-scale batteries were commissioned in NSW during FY2026, and more than 4.5 GW across the NEM. It is this timing that has led some commentators to suggest batteries have delivered the long-awaited solution to peak demand and energy transition problems.
Source: Frontier Economics analysis of market data
We have put this claim to the test using Frontier Economics’ proprietary energy modelling suite, energy42, an integrated platform that co-optimises multiple sectors including electricity, gas and renewable fuel.

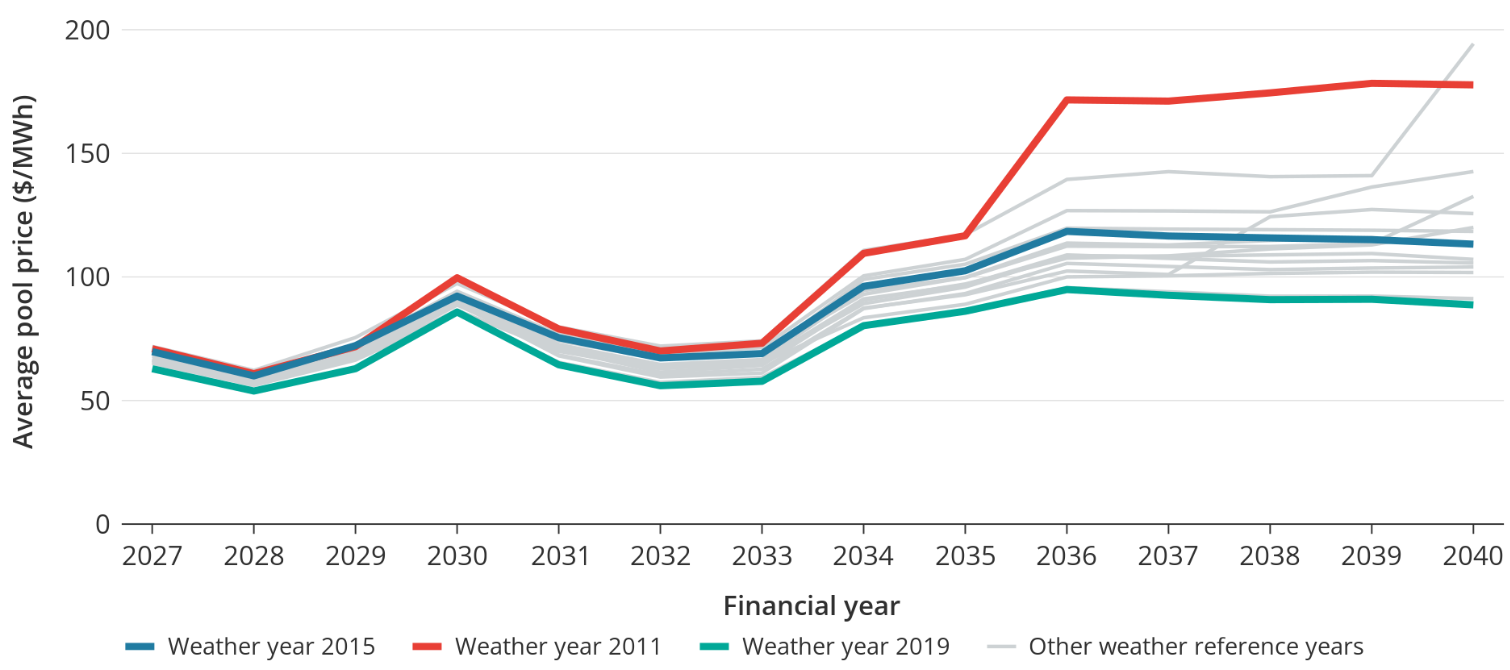
Weather can have a significant impact on the electricity system, so we ran all simulations across the 15 weather reference years published by AEMO. Figure 2 shows modelled NSW prices in our Base case between FY2027 and FY2040. The increasing price spread across the reference years between FY2027 and FY2040 points to important structural changes in the drivers of the demand-supply balance as more baseload generators are retired from the system. In this analysis, we focus on FY2027 and FY2040 to demonstrate the fundamental changes in the nature of “peak demand” and the solutions required in the years to come.
Source: Frontier Economics
Do batteries solve the summer peak demand problem?
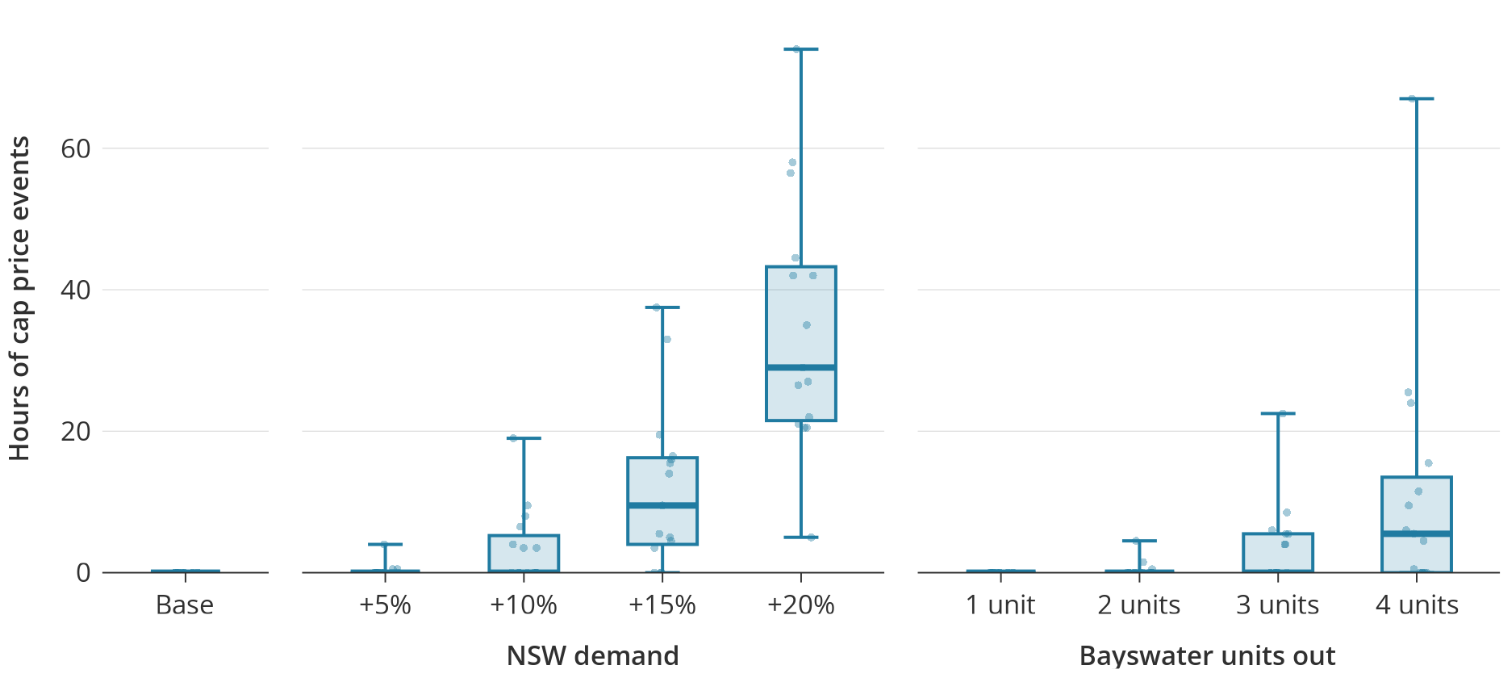
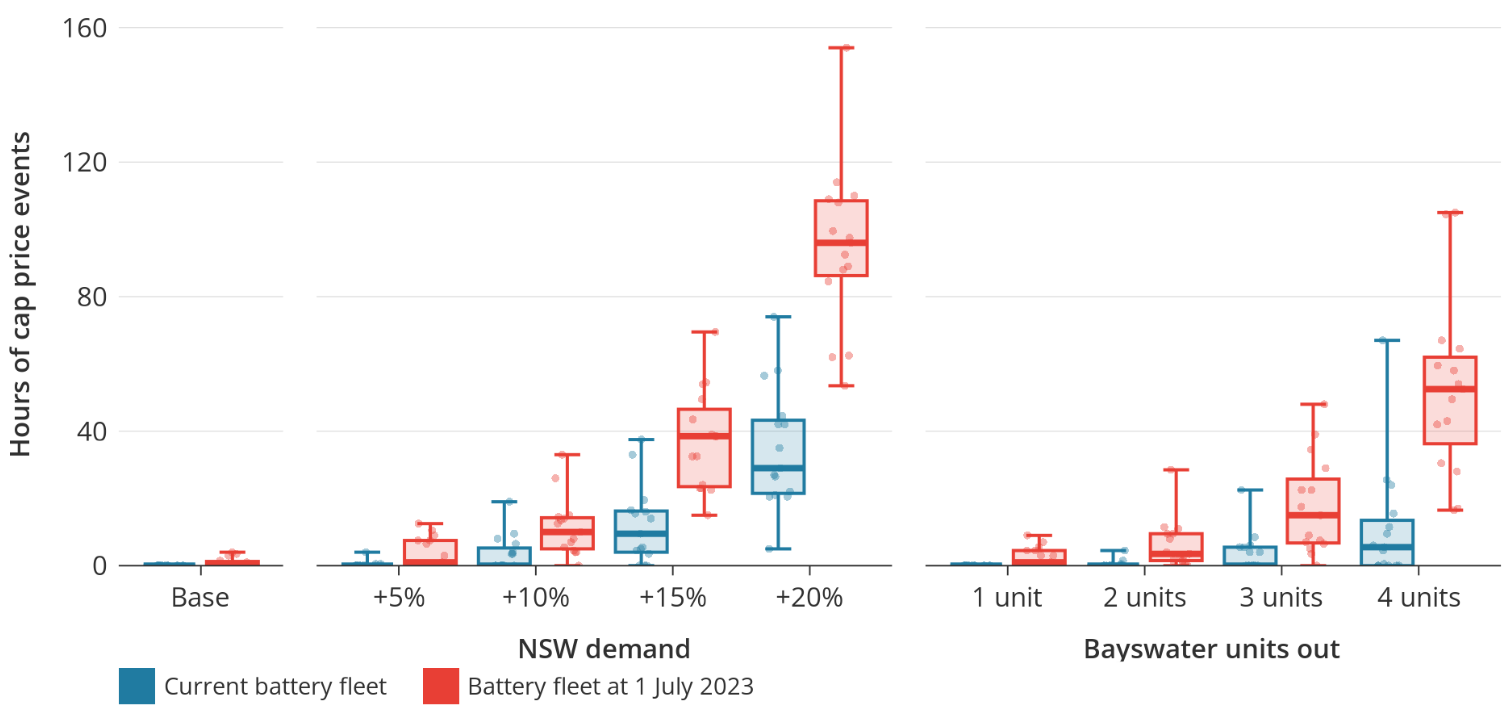
Figure 3 shows our results for today’s system (FY2027). In the Base case, the NSW market would see very few cap events without any unexpected shocks, as one would expect from a well-interconnected system that has seen steady investment since the closure of AGL’s Liddell Power Station. The Base case applies scheduled maintenance outages from AEMO’s market information and average expected forced outage derating to the rest of the generation fleet. Starting from the Base case on the left, we apply successively larger demand and supply shocks moving to the right. The box-and-whisker plots show the distribution of hours of cap events across 15 reference years in the Base case and the successive shock cases.
Of course, the real market is far more volatile than the Base case: on top of the weather years we modelled, ongoing disturbances such as demand spikes, generation and transmission outages and constraints, and participant bidding behaviour could lead to high prices. While we could simulate these conditions in detail, in essence, their net effect is either to add demand or remove supply. In this analysis, we proxy the impact of these real-market fluctuations by adding aggregate demand and supply shocks to the Base case model.
Our simulation shows the NSW system in 2027 is surprisingly resilient. We test demand shocks of 5% to 20% in 5% increments, applied to all half-hours in the year; for NSW, a 5% demand increase adds approximately 650 MW to the peak demand. The supply shocks are represented by taking out 1 to 4 units of the Bayswater Power Station (approximately 660 to 680 MW each) for the whole year.3
The results show three clear thresholds:
- At approximately 650 MW shock (5% demand or 1 unit on outage), cap events only occur occasionally in the worst weather conditions.
- At approximately 1,300 MW shock (10% demand or 2 units on outage), cap events start to happen more frequently.
- At over 2,500 MW shock (4-unit outage or 20% demand uplift), cap events become a common occurrence and can reach close to their historical peak levels if unfavourable weather conditions prevail.
Source: Frontier Economics
Figure 4 shows the merit order of NSW supply available capacity ranked from cheapest to most expensive – against its forecast POE50 peak demand of 13,147 MW, the level of peak demand expected to be exceeded one year in two. The NSW battery fleet of over 3 GW appears to provide a healthy capacity buffer before cap events could arise.

Source: Frontier Economics
To test this hypothesis, we simulate the FY2027 system again with the NSW battery energy storage system (BESS) fleet reduced to 60 MW - its capacity around the start of FY2024. Figure 5 shows the hours of cap events with the reduced battery fleet in red box-and-whisker plots. Without the 3 GW battery fleet, NSW cap events would increase sharply in FY2027. Even a small shock (5% demand or 1 unit on outage) is sufficient to generate cap events in most weather years. With large shocks (20% demand or 4 units on outage), cap events would far exceed historical maximum levels.
Source: Frontier Economics
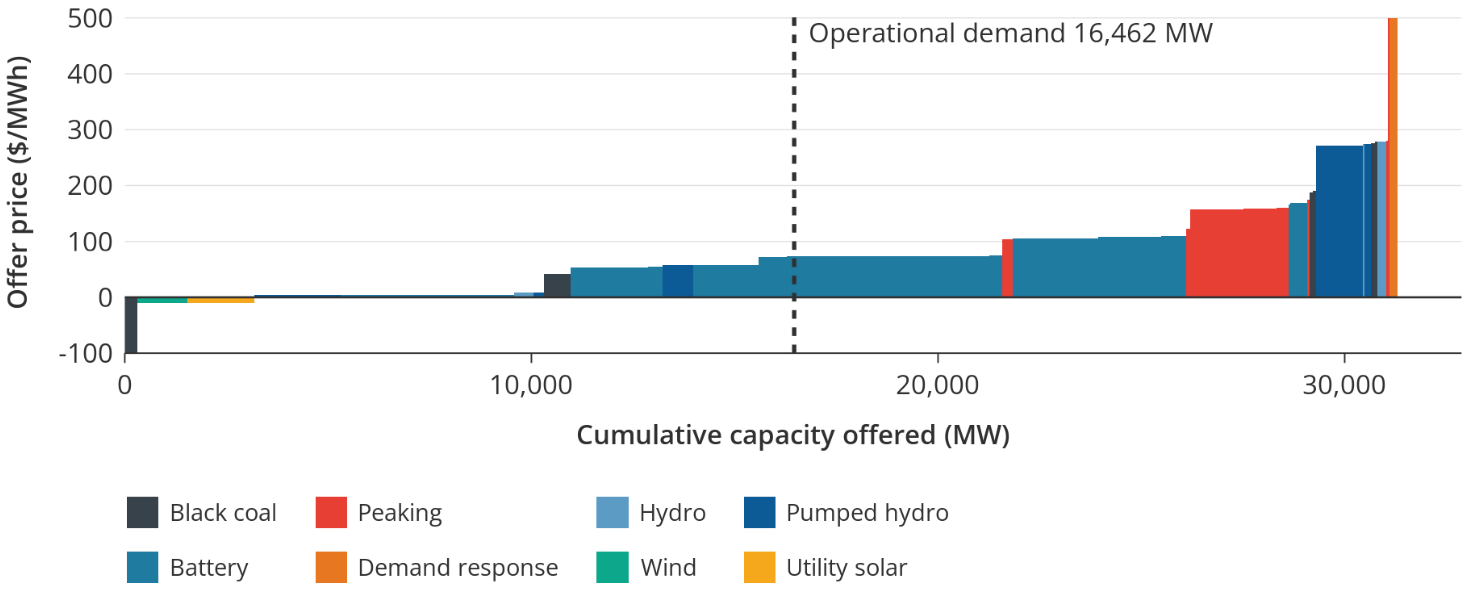
Our energy42 modelling shows that batteries are an effective solution to the peak capacity problem that has been at the centre of electricity market design and system planning for decades: they are flexible, and the recent cost reduction has made them a cost-effective option for meeting those short and sharp early evening demand spikes. The entry of batteries is further fuelled by the continued subsidies from various government schemes, potentially oversaturating the market in the years to come. As a result, the installed capacity in the system will far outgrow peak demand by FY2040, as illustrated in Figure 6, which shows the capacity merit order on the peak demand day in FY2040.
The FY2040 battery fleet, including household virtual power plants (VPP) and electric vehicles (EV), appears to provide a thick capacity buffer that would not be pierced even if peak demand nearly doubled from the current forecast. Does this mean the peak problem is behind us? Unfortunately not. A high renewable penetration system is about to create a new peak for system planners and policymakers to conquer.
Source: Frontier Economics modelling and analysis of market data
Renewable energy droughts: the new peak challenge for the NEM
In a future high renewable penetration system, prolonged low renewable availability is a new form of generation outage. This matters because meeting the peak challenge requires managing fluctuations in both demand and supply. Prices are often higher on a day of moderately high demand coupled with a few well-timed major supply outages than on the maximum demand day when all supply was available.
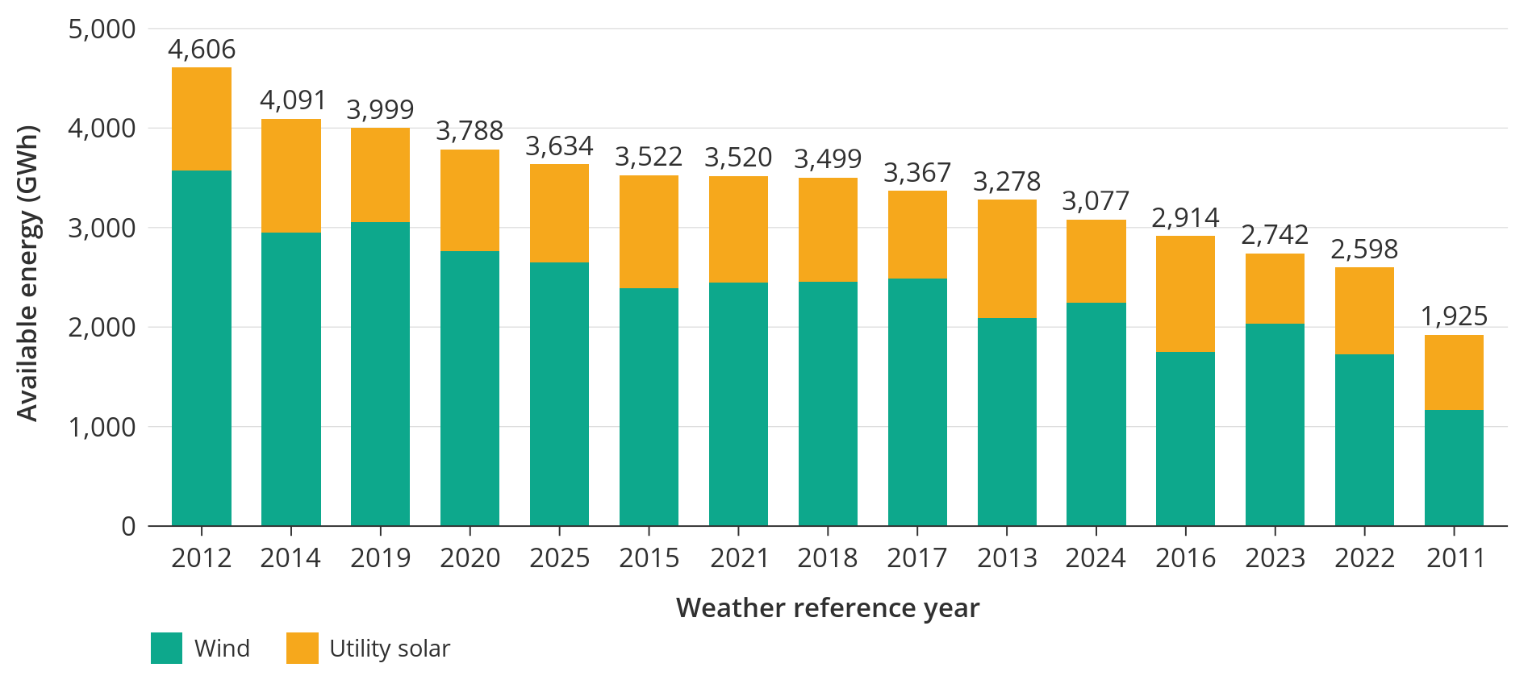
Figure 7 shows the available renewable energy in the NEM in the first week of FY2040 under different weather years. In the worst weather year (ref. year 2011), the available renewable energy for the week is nearly 60% less than that in the most abundant one (ref. year 2012). This represents a significant supply shock, considering that in the long-term renewables are expected to deliver more than 80% of generation.
Source: Frontier Economics analysis of AEMO weather year data
What is peak residual energy demand?
Peak residual energy demand is the new peak a future high renewable penetration system must meet. Residual energy demand is operational demand minus grid solar and wind availability over a period, expressed in GWh. Unlike traditional peak demand, it is not measured in instantaneous (i.e., half-hourly) demand, but over a continuous period that lasts as long as the renewable energy drought.
Designing the future market therefore means ensuring there are enough resources to meet this residual demand as it fluctuates with renewable availability. Because wind droughts and extended overcast periods can last for days or longer, these resources must be able to generate continuously over that period. For the rest of this analysis, we adopt a daily measure for convenience of presentation. However, as our modelling below shows, renewable droughts often last much longer.
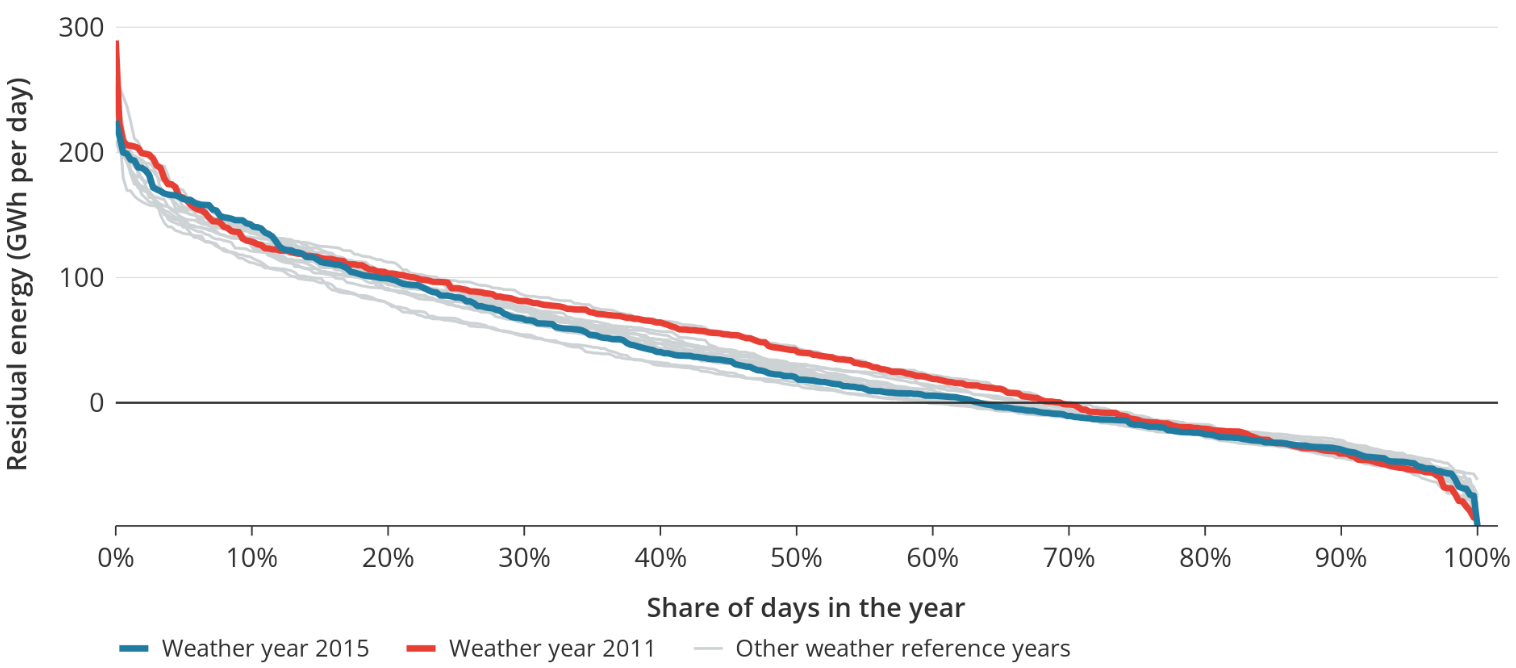
On the worst residual energy demand day (reference year 2011), NSW needs nearly 290 GWh of net energy injection – around eight times the average daily value of 36 GWh. In comparison, the maximum half-hourly demand is typically only around twice the average. Figure 8 shows this new peak using a duration curve of daily residual energy demand in FY2040 across the 15 reference years. The peakiness of residual energy demand is intuitive: when more than half of the most dominant energy resource can be unavailable for more than a day, the need for backup supply will naturally skyrocket.
Source: Frontier Economics
Why batteries can’t fill the gap
So, what about the tens of GWs of battery fleet? Unfortunately, one major limitation of storage assets is that they do not create net energy. When there is a renewable energy drought, there is simply no surplus energy to charge the batteries, and the entire fleet can do very little in meeting peak residual energy demand. Even longer-duration storage such as pumped hydro will eventually run out in a multi-day renewable energy drought.
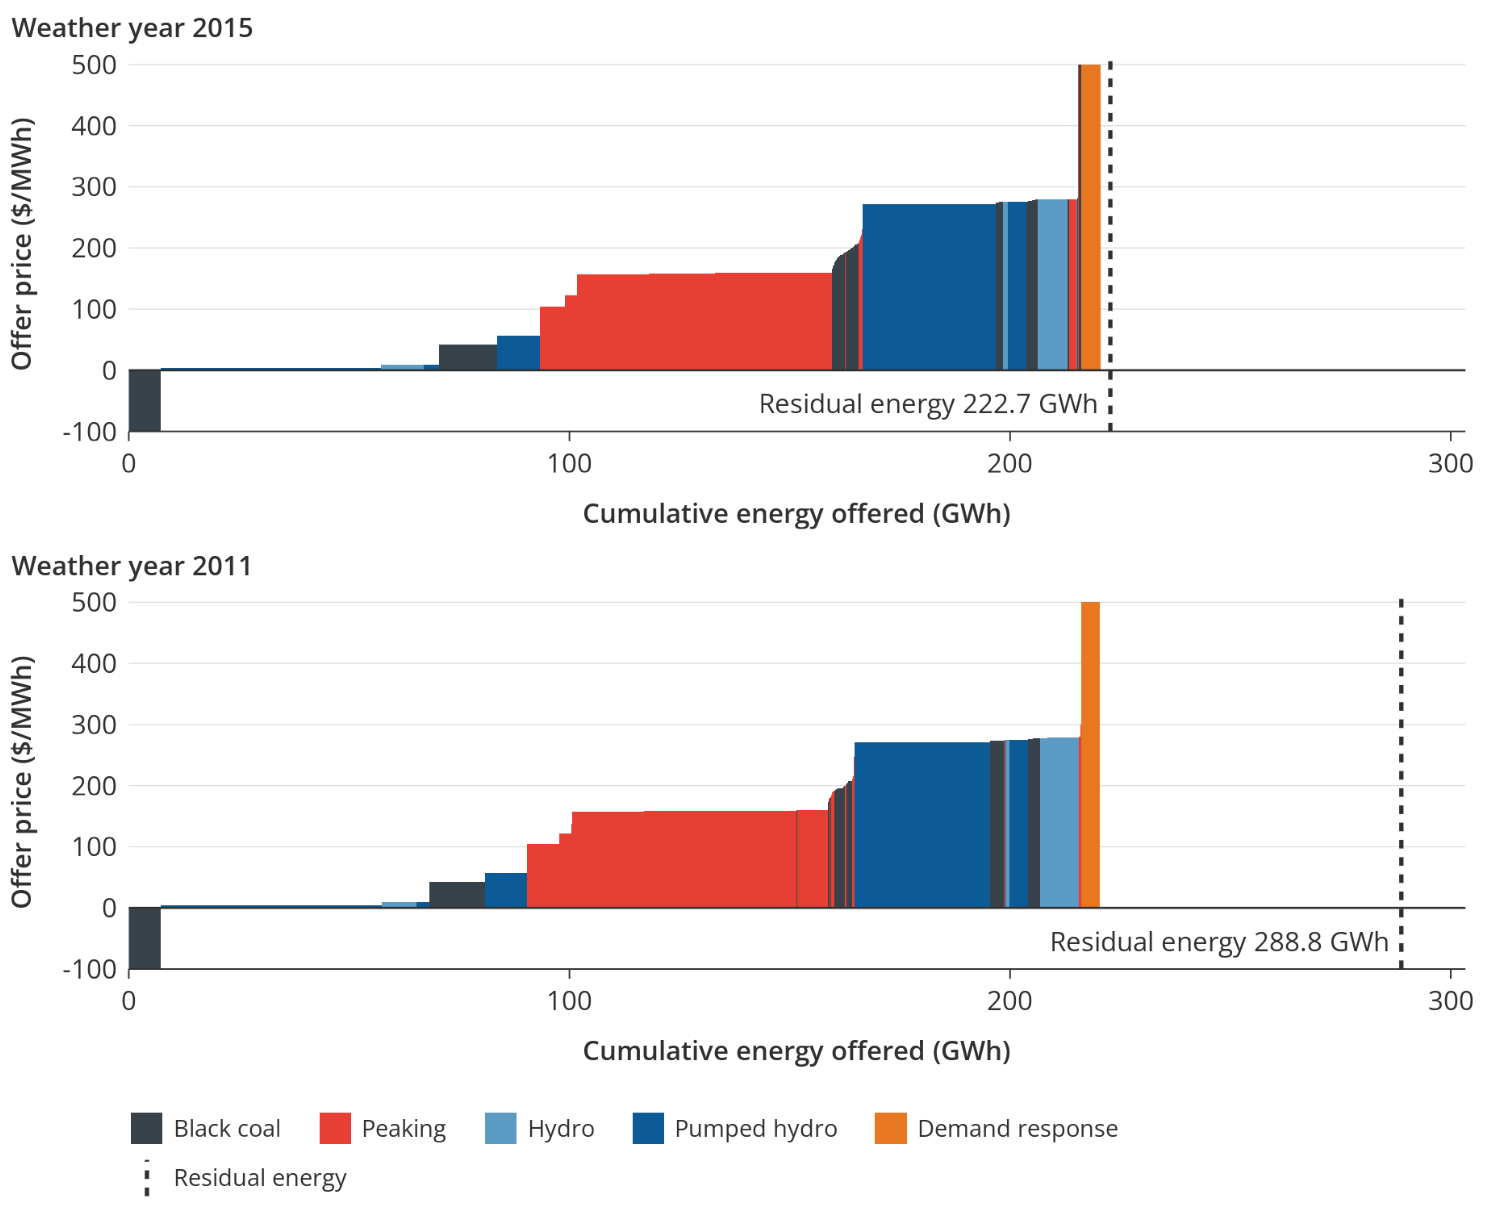
To depict this new challenge, Figure 9 redraws the FY2040 merit order chart for FY2040 in terms of daily total energy GWh, rather than instantaneous capacity in MW. It covers the peak residual energy demand days in 2015 and 2011 weather reference years for the FY2040 NSW system. Given batteries do not inject net energy, we have excluded storage below 12 hours in this chart. The contrast with the traditional capacity-based version as in Figure 6 is stark. Instead of having a healthy buffer, the system will struggle to meet its residual energy needs on these peak days.
In the more moderate 2015 weather year, load shedding might be avoided through interconnection. However, because weather is correlated, other NEM regions will likely experience similar renewable droughts, so imports will be expensive even if they are available. In the true residual energy demand peak that occurs in the 2011 weather year, there will not be enough imports to plug the gap of this size, as our modelling confirms.
Source: Frontier Economics
What renewable droughts mean for prices
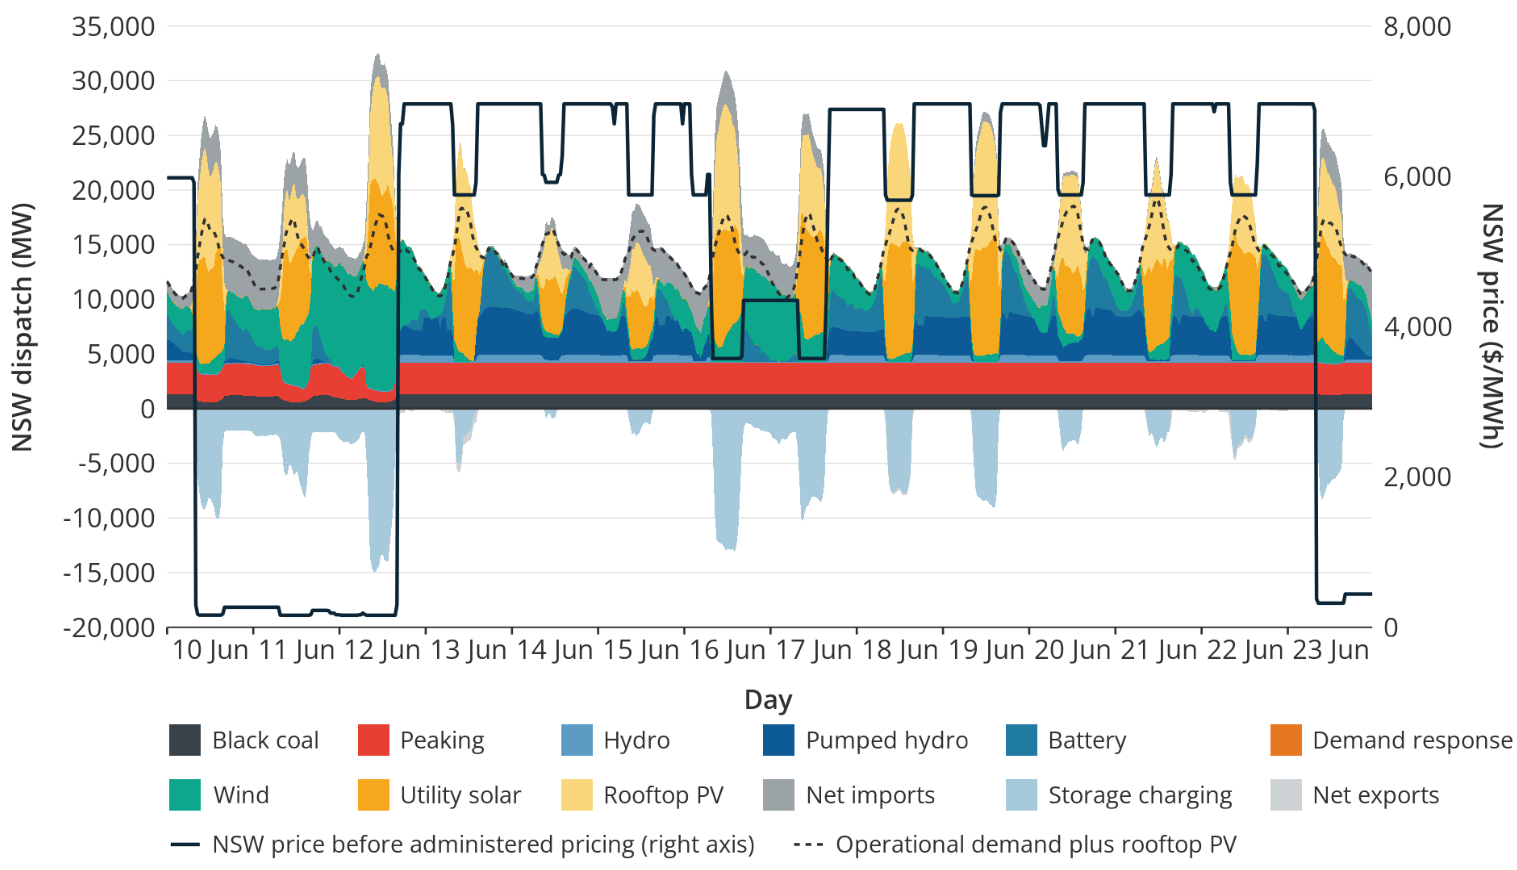
The new peak also changes the pricing dynamics. Figure 10 shows dispatch and pricing outcomes in a renewable energy drought that lasts for more than a week (between 13 June and 23 June, due to low wind output) in FY2040. We have chosen the 2015 weather reference year for this illustration, which sits around the median of the distribution. The renewable droughts can be significantly worse in more extreme weather years such as 2011, as shown in Figure 7 and Figure 9. By this time, most of the baseload coal plants have exited the market in NSW and Victoria. Based on the expected closure date as published by AEMO (which is adopted in this modelling), only Energy Australia’s Mt Piper Power Station will be left in NSW by that time, and the system relies largely on hydro, gas and long-duration storage to meet residual energy demand.
The chart confirms that:
- storage sees very limited utilisation when renewable energy is most scarce (between 13 and 15 June and 20 to 22 June),
- the system relies primarily on the thermal, hydro and very long-duration storage assets (i.e., Snowy 2.0) to meet the residual energy demand,
- high prices last throughout the entire renewable drought.
The prolonged high prices make economic sense: a megawatt-hour of energy is equally valuable throughout the energy drought; otherwise, someone could make a profit (accounting for storage loss) by shifting that megawatt-hour to a higher-priced interval. In practice, the Administered Price Cap (APC) would kick in and keep the prices at $600/MWh; we have presented the pre-APC prices to show the full extent of the peak residual energy demand challenge.
Source: Frontier Economics
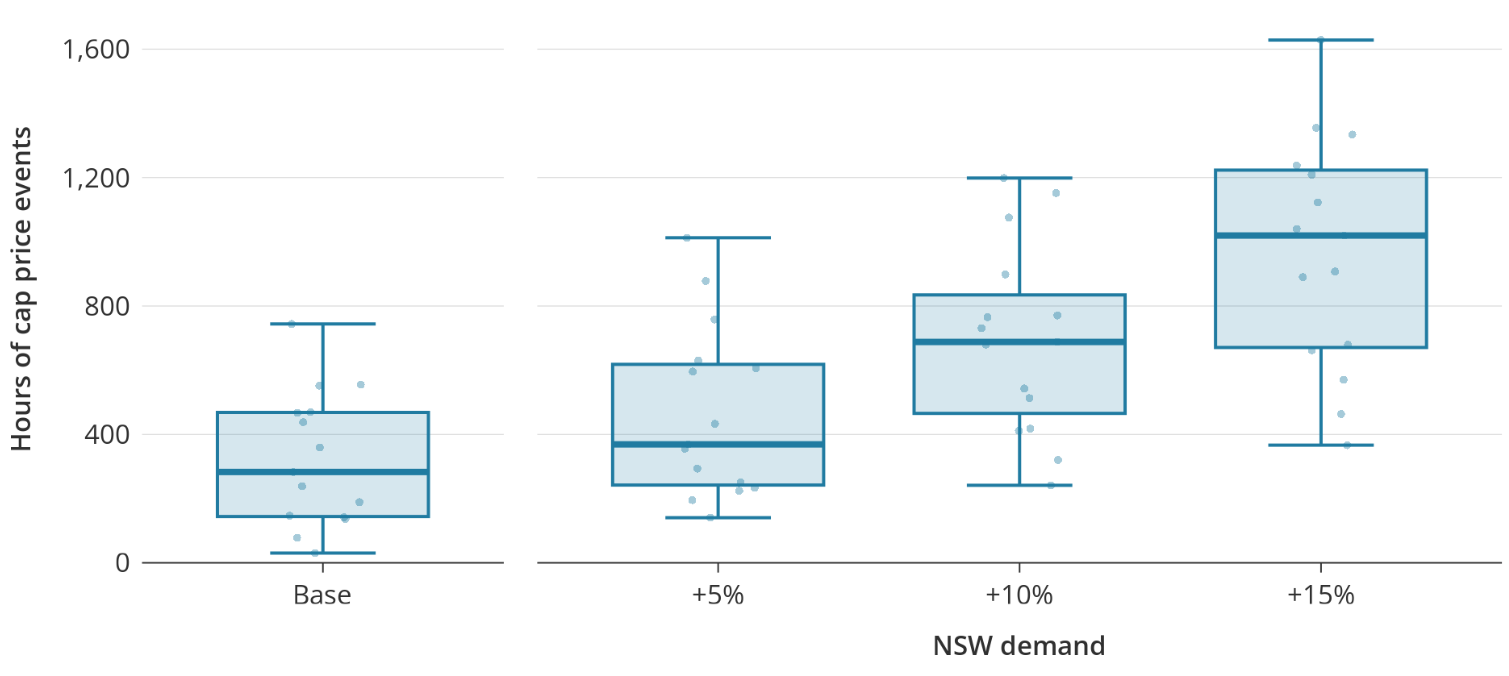
In FY2040, the market is expected to experience a resurgence of high prices as it faces the new peak challenge. Our modelling (Figure 11) shows that, even in the Base case, cap events are common and can reach hundreds of hours in an average weather year. Without enough buffer against the new peak, a moderate shock, such as a 10% demand uplift, can triple the cap events even in the average weather year and pose significant pricing and reliability challenges in more adverse weather conditions. As our example in Figure 10 shows, a single wind drought can lead to days of high prices. This is in stark contrast with the current (FY2027) system but should not come as a surprise at this point: the battery fleet is of limited use in meeting energy shortages due to its inherent inability to provide net energy supply.
Source: Frontier Economics
Batteries, hybrid or gas: what works best?
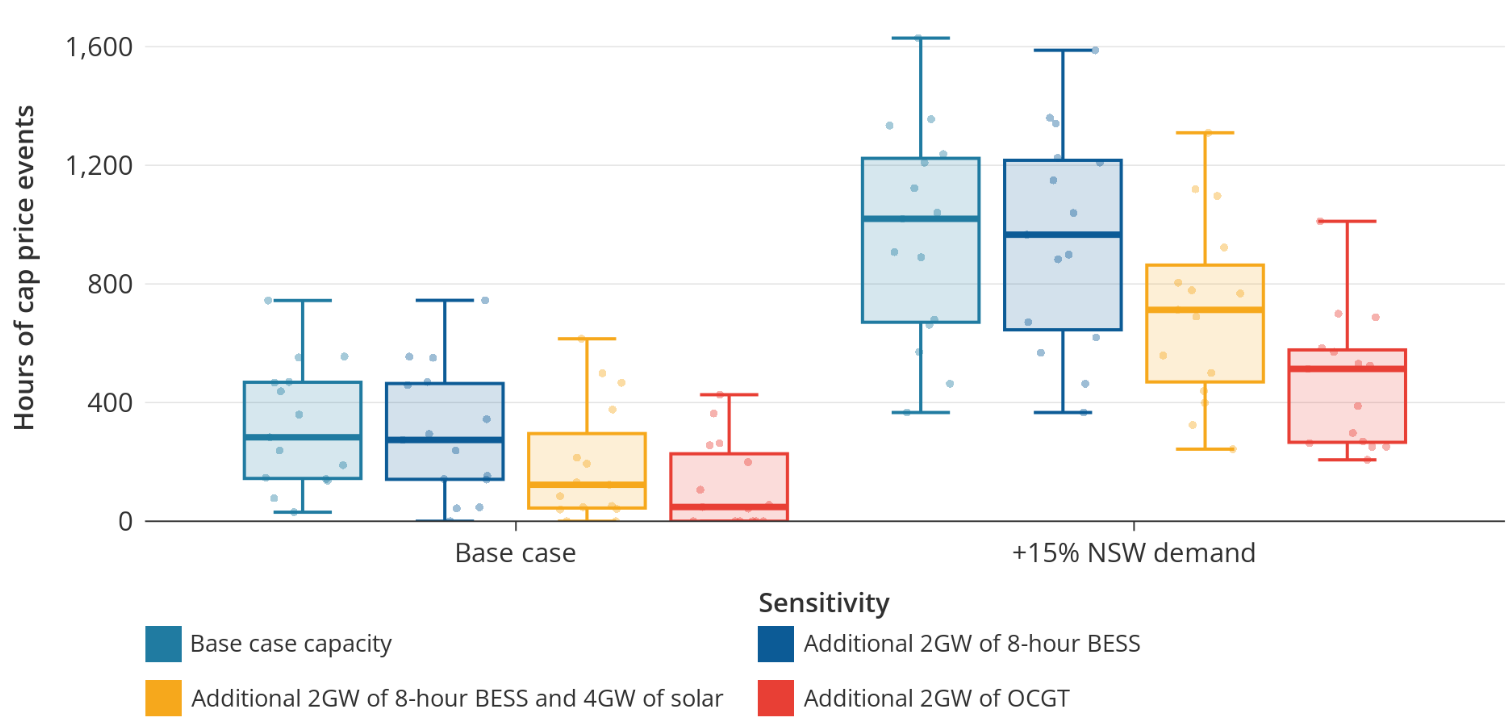
So how do we meet the new peak challenge? As it is an energy-related peak, stacking additional battery capacity will be as effective as hoarding toilet paper rolls in a famine. The solution must rely on some form of net energy injection. Pairing batteries with renewables such as solar can help, but solar output is low in winter and also depends on the weather. Gas or other fuel-based plants offer an alternative that, in theory, can supply uninterrupted energy backup, provided fuel supply is available. Below, we test the impact of adding the following additional capacity to the FY2040 NSW mix:
- 2 GW/8-hour BESS
- 2 GW/8-hour BESS paired with 4 GW solar
- 2 GW gas peaker
Figure 12 shows the result. Unsurprisingly, gas is the most effective option in improving the resilience of the energy system. Its potential to supply uninterrupted energy makes it the most targeted and effective solution to the energy-driven peak challenge. As expected, the additional BESS has no material effect in solving an energy shortage. The solar/BESS alternative provides some relief in average weather years but is less effective in the worst ones because solar itself can experience extended low output periods.
Source: Frontier Economics
What this means for Australia’s future energy system
The peak challenge facing the energy system is changing. The reduction in BESS costs, combined with a plethora of government incentives, means the traditional capacity shortage during peak demand is now behind us. However, as traditional baseload generators retire, new inflexible demand (i.e., data centres) emerges, and renewable penetration increases, the system will inevitably experience greater fluctuation in energy supply. It will soon face a new peak: meeting the residual energy demand during renewable energy droughts.
One potentially effective solution is to build an alternative form of baseload generation to provide a solid foundation for the rest of the system. Unfortunately, such an option is still controversial and could take some time (or a few near-death experiences with blackouts) for the penny to drop for policymakers. In the meantime, what are the solutions for meeting the new energy-related peak?
Batteries are not a solution to this new energy-driven challenge, as they do not create net energy. Even hybrids are of limited effectiveness, because low renewable output itself is the primary driver of the residual energy demand peak. Gas, supported by adequate fuel supply, will be the most effective solution because it can provide ongoing energy supply. It is also likely the most cost-effective solution. Using AEMO’s 2026 Integrated System Plan (ISP) Step Change capital cost projections, the upfront capital cost of 2 GW of gas plant is just over $2bn, compared with nearly $6bn for the solar/BESS hybrid in FY2040.
The idea that the future peak challenge lies with residual energy demand and the importance of gas generation is gaining traction among energy experts and policymakers. AEMO Services has recently expressed a strong preference for fuel-based generation in its consultation paper for the 2027 NSW firming tender.
An integrated energy system roadmap that explicitly recognises the interdependencies between fuel-based firming assets, including their production and transportation facilities, and the electricity system, is critical to support our long-term decarbonisation objectives while keeping our electricity supply affordable and reliable.
At Frontier Economics, we use our proprietary energy model, energy42, which co-optimises electricity, gas and other renewable fuels, to provide advice to policymakers and market participants.
In our next article, we will focus on gas in the future energy system, including the role it plays if the drive for decarbonisation takes us down different paths and the implications for gas system planning.
LEARN MORE ABOUT OUR ENERGY PRACTICE
Frequently asked questions: batteries, renewable energy droughts and the future of peak demand
What is peak demand in the energy system, and how does it change over time?
Peak demand is a period of “tightness” in the electricity system where prices and the risk of load shedding are high. Traditionally, it is a short, sharp spike in electricity use, typically lasting a few hours on hot summer early evening periods. It is driven by high demand meeting limited generating capacity, and it has shaped electricity planning for decades. By around 2040, coal closures, new demand growth and growing renewable penetration lead to a new peak: peak residual energy demand. This is the energy needed when wind and solar output stays low for days.
What is a renewable energy drought?
A renewable energy drought is a prolonged period, lasting days or longer, when wind and solar output stays low across the system, for example during a wind drought or an extended overcast spell. In a high-renewable system, it acts like a long generation outage. Frontier Economics’ modelling shows that in winter FY2040 in the National Electricity Market (NEM), available weekly renewable energy in the worst weather year is nearly 60% less than in the most abundant one.
Can batteries meet future electricity peak demand, and what other technologies are needed?
Different peaks need different solutions: batteries are very effective for today’s short electricity capacity peaks, while gas peaking plants supported by adequate fuel supply works best for the future energy peak. Batteries are highly flexible and less prone to outages, and Frontier Economics’ modelling shows NSW’s battery fleet has sharply reduced price spikes. However, batteries store energy rather than create it, so they cannot cover renewable droughts lasting days. The future energy peak needs sources that supply energy continuously. In Frontier Economics’ energy42 modelling, gas peaking plants supported by adequate fuel supply were the most effective option, and likely the most cost-effective. Solar paired with batteries helped in average years but struggled when solar output itself was low.
Why can’t batteries solve renewable energy droughts?
Batteries store energy but do not create net energy. When renewable output is low for days, there is no surplus energy to charge them, so the fleet can do very little to meet peak residual energy demand. Even longer-duration storage such as pumped hydro will eventually run out in a multi-day renewable energy drought. Meeting this peak needs a source of net energy, such as gas supported by adequate fuel supply.
What does the new peak mean for electricity system planning?
System planners need to shift their focus from short peaks to ensuring there is enough energy during multi-day renewable droughts. This is a new peak challenge that can only be met with sustained net energy injection instead of building more batteries. Gas will play a key role as firming capacity, which means planning must account for gas production, transportation and fuel availability, not just power stations. This requires an integrated view of the gas and electricity systems. Frontier Economics’ proprietary energy42 model co-optimises electricity, gas and renewable fuels, helping policymakers and market participants plan a reliable and cost-effective path to decarbonisation.
Footnotes
-
The fair cap value is the average outturn price component above $300/MWh. ↩
-
Our calculation is unaffected by the switch to 5-minute settlement in October 2021, as it is a simple count and average of the 5-minute dispatch intervals where pool prices are above the cap strike price. ↩
-
Some Bayswater units are already under maintenance for part of the year. As a result, despite the similarity in the MW of demand and supply shocks, a unit outage tends to have a smaller impact than a 5% demand increment. ↩
Authors: Franklin Liu and Daniel Picone. Industries: Energy & Renewables, Climate Change & Sustainability, Public Policy & Government, Retail & Consumer. Expertise: Economic Models.